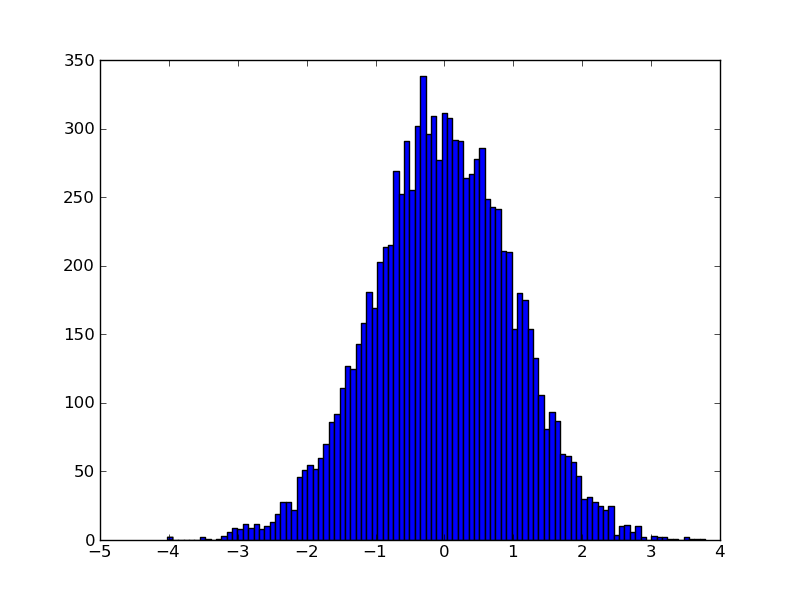
30 second tutorial for ipython, pylab, numpy and matplotlib http://slacy.com/blog/2008/01/30-second-tutorial-for-ipython-pylab-numpy-and-matplotlib/ より
datafile:
1 2 3
2 3 4
3 2 3
4 1 2
5 0 1
6 1 0
7 2 1
8 3 2
9 2 3
これを読み込んでプロットしてみる。
load() では駄目で、loadtxt() ならOK。
pylab no longer provides a load function, though the old pylab function is still available as matplotlib.mlab.load (you can refer to it in pylab as "mlab.load"). However, for plain text files, we recommend numpy.loadtxt, which was inspired by the old pylab.load but now has more features. For loading numpy arrays, we recommend numpy.load, and its analog numpy.save, which are available in pylab as np.load and np.save.
とな
legend() というのはグラフの凡例を描画してくれるらしい。
your_data = loadtxt("./datafile")
plot(your_data)
legend()
show()
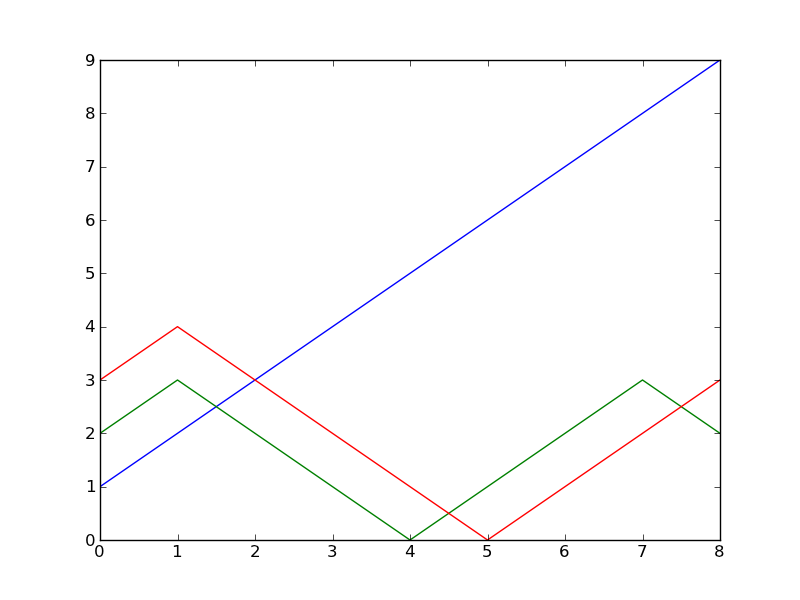
最初のカラムをX軸と取ったらこんな感じ?
x = loadtxt("./datafile")
plot(x[:,0], x[:,1])
plot(x[:,0], x[:,2])
show()
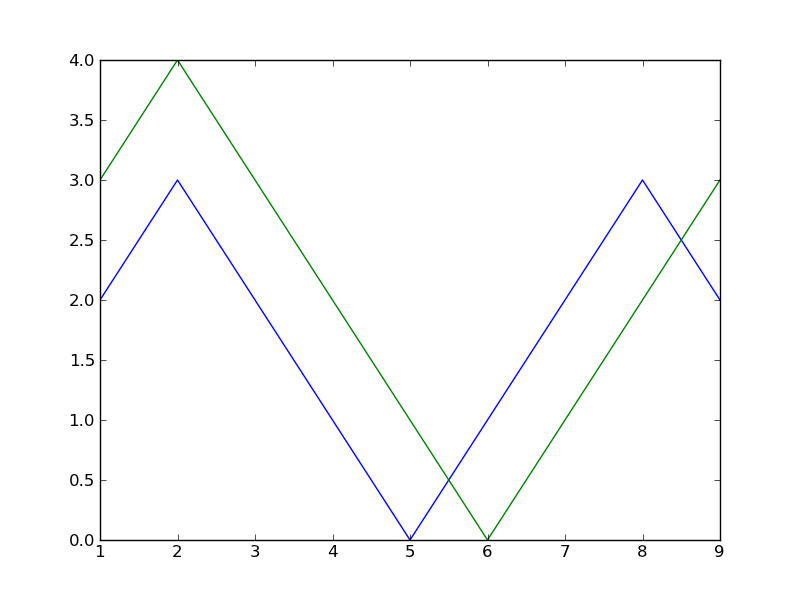
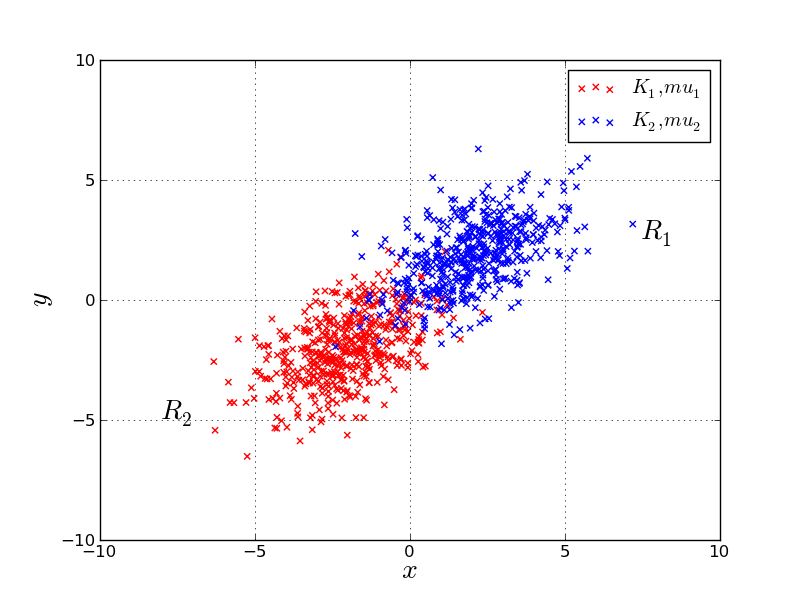
pythonで二次元正規分布に従う乱数をプロットする http://room6933.com/blog/2011/08/03/multivariate_normal_python/ より
#coding:utf-8

import numpy as np
import matplotlib.pyplot as pylab

#平均
mu1 = [-2,-2]
mu2 = [2,2]
#共分散
cov = [[2,1],[1,2]]

#500はデータ数
x1,y1 = np.random.multivariate_normal(mu1,cov,500).T
x2,y2 = np.random.multivariate_normal(mu2,cov,500).T

#グラフ描画
#背景を白にする
pylab.figure(facecolor="w")

#散布図をプロットする
pylab.scatter(x1,y1,color='r',marker='x',label="$K_1,mu_1$")
pylab.scatter(x2,y2,color='b',marker='x',label="$K_2,mu_2$")

#ついでにグラフの中に文字を入れてみる
pylab.figtext(0.8,0.6,"$R_1$",size=20)
pylab.figtext(0.2,0.3,"$R_2$",size=20)

#ラベル
pylab.xlabel('$x$',size=20)
pylab.ylabel('$y$',size=20)

#軸
pylab.axis([-10.0,10.0,-10.0,10.0],size=20)
pylab.grid(True)
pylab.legend()

#保存
pylab.savefig("multivariate_normal.png",format = 'png', dpi=200)
pylab.show()
pylab.close()
ぐうたらの部屋 数学・物理部 Matplotlib サンプルコード http://guutaranoheya.web.fc2.com/math/matplotlib_ex.html より
多分こっちが本家 http://matplotlib.sourceforge.net/gallery.html
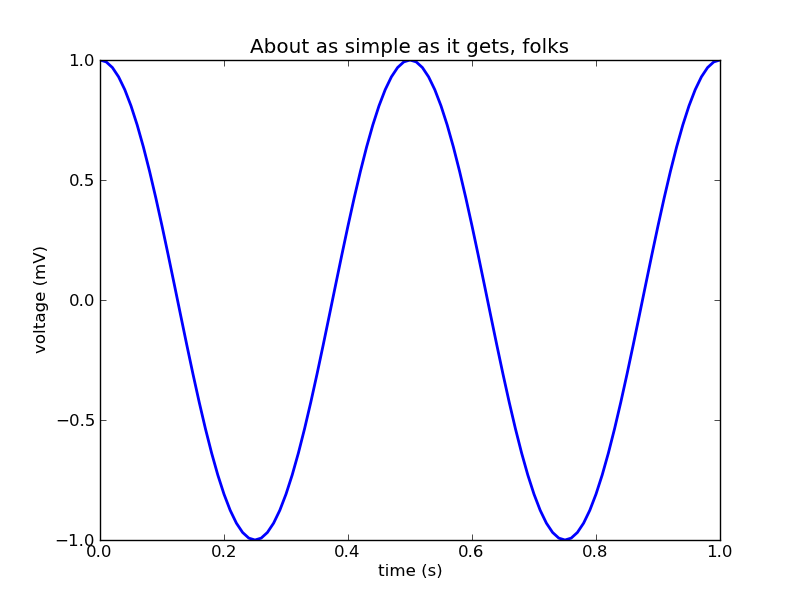
簡単な2Dグラフを描画する
from pylab import *

t = arange(0.0, 1.0+0.01, 0.01)
s = cos(2*2*pi*t)
plot(t, s, '-', lw=2)

xlabel('time (s)')
ylabel('voltage (mV)')
title('About as simple as it gets, folks')
grid(True)

show()
簡単な3Dグラフを描画する
- matplotlib.numerix.outerproduct(x,y) → numpy.outer(x,y)
- matplotlib.axes3d → mpl_toolkits.mplot3d.axes3d
import matplotlib
import numpy as np
from numpy import arange, cos, linspace, ones, pi, sin, outer
#from matplotlib.numerix import outerproduct

import pylab
#import matplotlib.axes3d as axes3d
import mpl_toolkits.mplot3d.axes3d as axes3d


fig = pylab.gcf()

ax3d = axes3d.Axes3D(fig)
plt = fig.axes.append(ax3d)

delta = pi / 199.0
u = arange(0, 2*pi+(delta*2), delta*2)
v = arange(0, pi+delta, delta)

x = outer(cos(u),sin(v))
y = outer(sin(u),sin(v))
z = outer(ones(u.shape), cos(v))

#ax3d.plot_wireframe(x,y,z)
surf = ax3d.plot_surface(x, y, z)
surf.set_array(linspace(0, 1.0, len(v)))

ax3d.set_xlabel('X')
ax3d.set_ylabel('Y')
ax3d.set_zlabel('Z')

pylab.show()
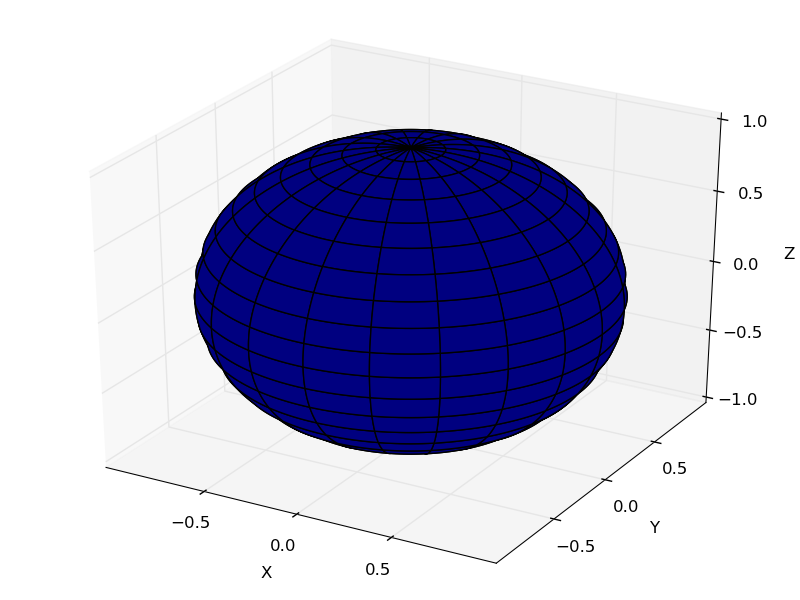
あれ?青一色だ
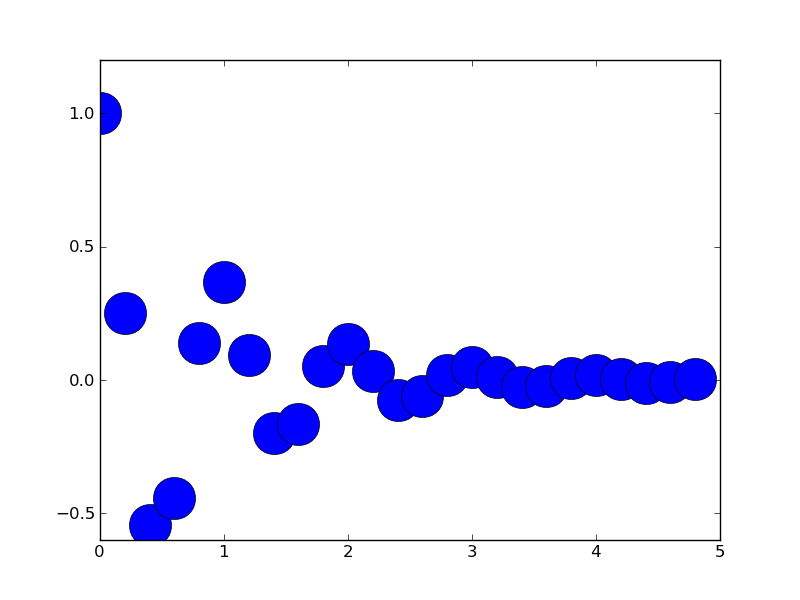
円でグラフを描画する
from pylab import *

def f(t):
    'a damped exponential'
    s1 = cos(2*pi*t)
    e1 = exp(-t)
    return multiply(s1,e1)

t1 = arange(0.0, 5.0, .2)


l = plot(t1, f(t1), 'ro')
setp(l, 'markersize', 30)
setp(l, 'markerfacecolor', 'b')
#savefig('arctest', dpi=150)
show()
円グラフを描画する
#!/usr/bin/env python
"""
Make a pie chart - see
http://matplotlib.sf.net/matplotlib.pylab.html#-pie for the docstring.

This example shows a basic pie chart with labels in figure 1, and
figure 2 uses a couple of optional features, like autolabeling the
area percentage, offsetting a slice using "explode" and addind a shadow
for a 3D effect
"""
from pylab import *

# make a square figure and axes
figure(1, figsize=(8,8))
ax = axes([0.1, 0.1, 0.8, 0.8])

labels = 'Frogs', 'Hogs', 'Dogs', 'Logs'
fracs = [15,30,45, 10]

figure(1)
pie(fracs, labels=labels)

# figure(2) showa some optional features.  autopct is used to label
# the percentage of the pie, and can be a format string or a function
# which takes a percentage and returns a string.  explode is a
# len(fracs) sequuence which gives the fraction of the radius to
# offset that slice.

figure(2, figsize=(8,8))
explode=(0, 0.05, 0, 0)
pie(fracs, explode=explode, labels=labels, autopct='%1.1f%%', shadow=True)

savefig('pie_demo')
show()
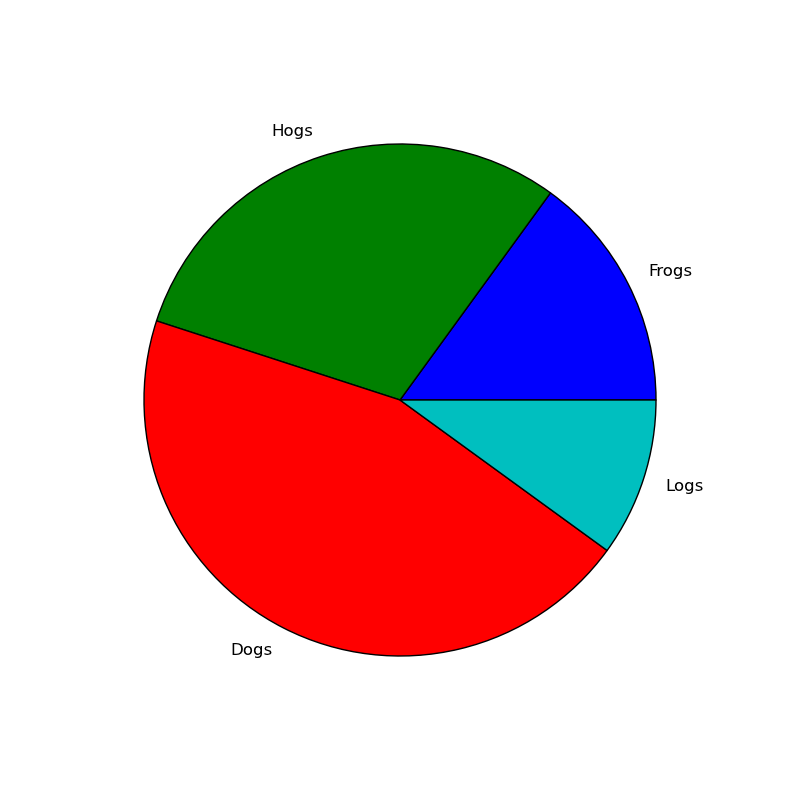
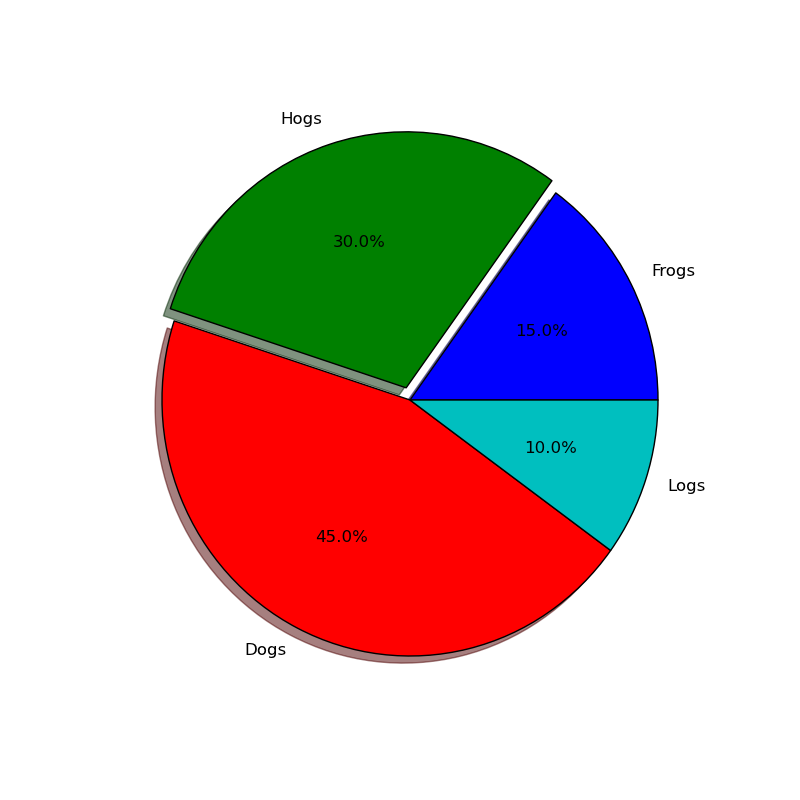
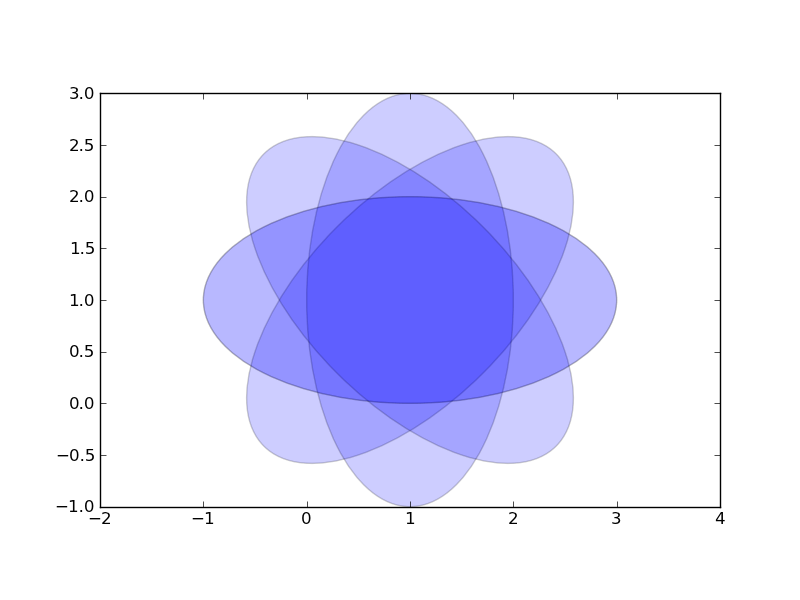
円弧を描画する
from pylab import *
from matplotlib.patches import Ellipse

delta = 45.0 # degrees

angles = arange(0, 360+delta, delta)
ells = [Ellipse((1, 1), 4, 2, a) for a in angles]

a = subplot(111, aspect='equal')

for e in ells:
    e.set_clip_box(a.bbox)
    e.set_alpha(0.1)
    a.add_artist(e)

xlim(-2, 4)
ylim(-1, 3)

show()
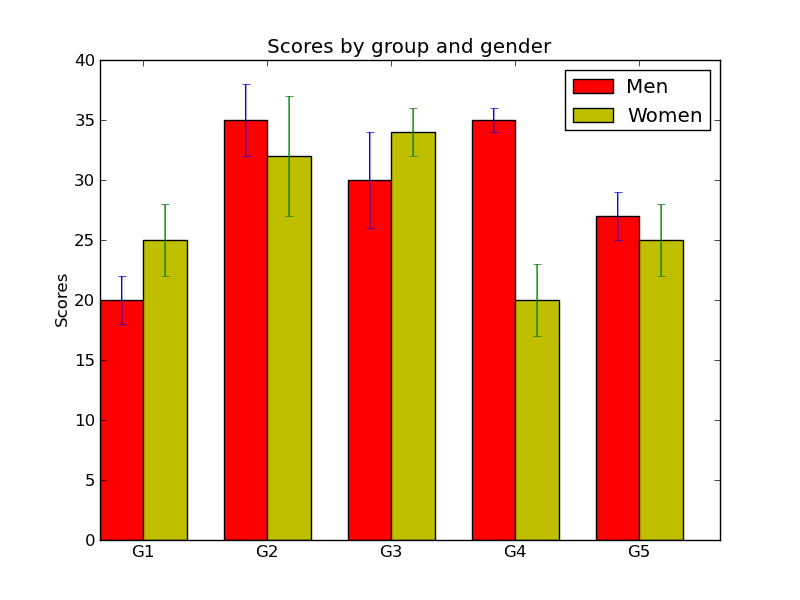
棒グラフを描画する
from pylab import *

N = 5
menMeans = (20, 35, 30, 35, 27)
menStd =   (2, 3, 4, 1, 2)

ind = arange(N)  # the x locations for the groups
width = 0.35       # the width of the bars
p1 = bar(ind, menMeans, width, color='r', yerr=menStd)

womenMeans = (25, 32, 34, 20, 25)
womenStd =   (3, 5, 2, 3, 3)
p2 = bar(ind+width, womenMeans, width, color='y', yerr=womenStd)

ylabel('Scores')
title('Scores by group and gender')
xticks(ind+width, ('G1', 'G2', 'G3', 'G4', 'G5') )

legend( (p1[0], p2[0]), ('Men', 'Women') )

#savefig('barchart_demo')
show()
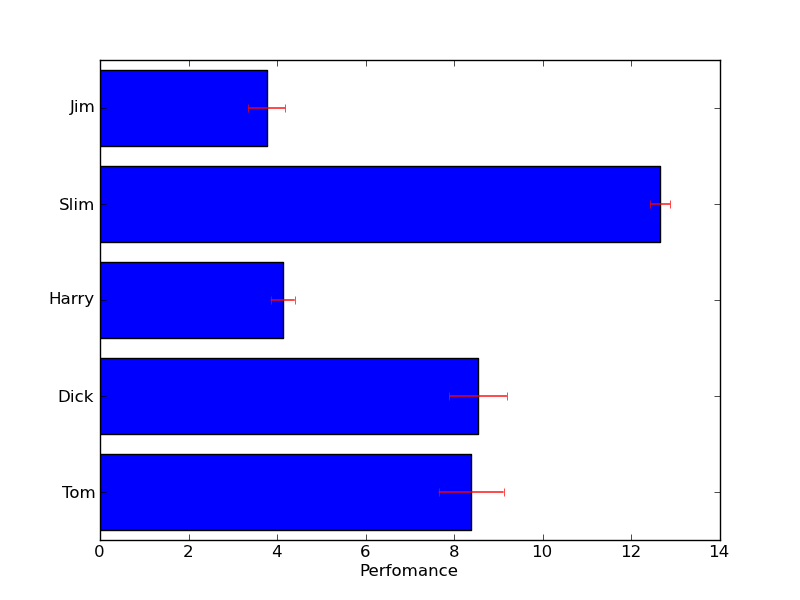
棒グラフを表示する。(棒が横向き)
#!/usr/bin/env python
# make a horizontal bar chart

from pylab import *
val = 3+10*rand(5)    # the bar lengths
pos = arange(5)+.5    # the bar centers on the y axis

figure(1)
barh(pos,val, align='center')
yticks(pos, ('Tom', 'Dick', 'Harry', 'Slim', 'Jim'))
xlabel('Perfomance')
title('How fast do you want to go today?')
grid(True)

figure(2)
barh(pos,val, xerr=rand(5), ecolor='r', align='center')
yticks(pos, ('Tom', 'Dick', 'Harry', 'Slim', 'Jim'))
xlabel('Perfomance')

show()
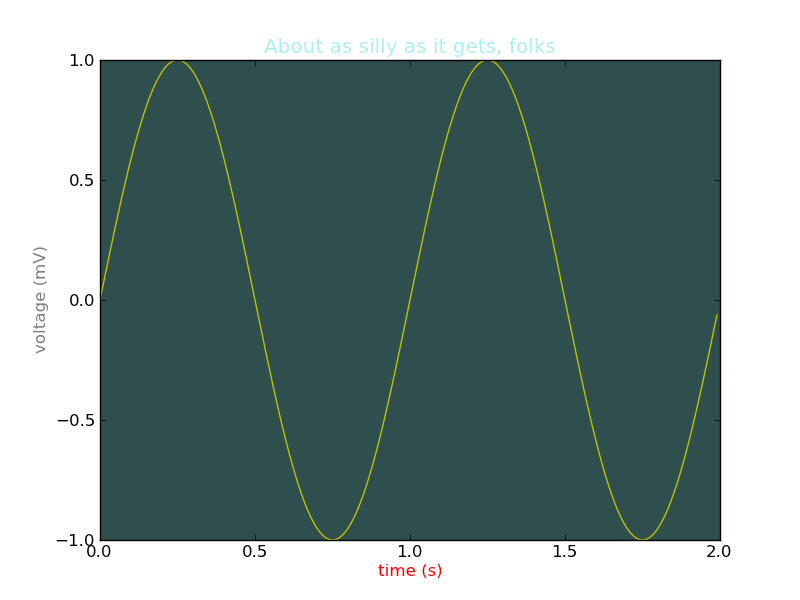
色を変更する
#!/usr/bin/env python
"""
matplotlib gives you 4 ways to specify colors,

    1) as a single letter string, ala matlab

    2) as an html style hex string or html color name

    3) as an R,G,B tuple, where R,G,B, range from 0-1

    4) as a string representing a floating point number
       from 0 to 1, corresponding to shades of gray.

See help(colors) for more info.
"""
from pylab import *

subplot(111, axisbg='darkslategray')
#subplot(111, axisbg='#ababab')
t = arange(0.0, 2.0, 0.01)
s = sin(2*pi*t)
plot(t, s, 'y')
xlabel('time (s)', color='r')
ylabel('voltage (mV)', color='0.5') # grayscale color
title('About as silly as it gets, folks', color='#afeeee')
show()
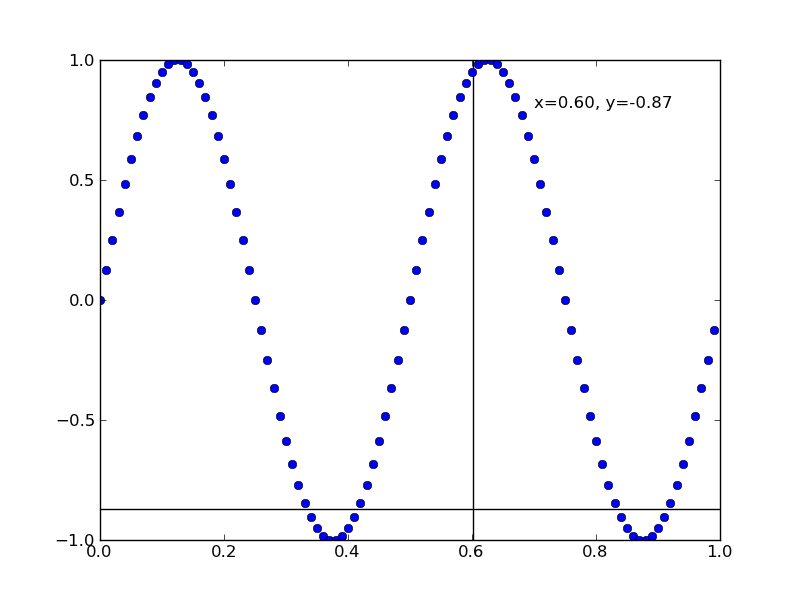
カーソルを置いた場所の値を表示する
#!/usr/bin/env python
"""

This example shows how to use matplotlib to provide a data cursor.  It
uses matplotlib to draw the cursor and may be a slow since this
requires redrawing the figure with every mouse move.

Faster cursoring is possible using native GUI drawing, as in
wxcursor_demo.py
"""
from pylab import *


class Cursor:
    def __init__(self, ax):
        self.ax = ax
        self.lx, = ax.plot( (0,0), (0,0), 'k-' )  # the horiz line
        self.ly, = ax.plot( (0,0), (0,0), 'k-' )  # the vert line

        # text location in axes coords
        self.txt = ax.text( 0.7, 0.9, '', transform=ax.transAxes)

    def mouse_move(self, event):
        if not event.inaxes: return
        ax = event.inaxes
        minx, maxx = ax.get_xlim()
        miny, maxy = ax.get_ylim()

        x, y = event.xdata, event.ydata
        # update the line positions
        self.lx.set_data( (minx, maxx), (y, y) )
        self.ly.set_data( (x, x), (miny, maxy) )

        self.txt.set_text( 'x=%1.2f, y=%1.2f'%(x,y) )
        draw()


class SnaptoCursor:
    """
    Like Cursor but the crosshair snaps to the nearest x,y point
    For simplicity, I'm assuming x is sorted
    """
    def __init__(self, ax, x, y):
        self.ax = ax
        self.lx, = ax.plot( (0,0), (0,0), 'k-' )  # the horiz line
        self.ly, = ax.plot( (0,0), (0,0), 'k-' )  # the vert line
        self.x = x
        self.y = y
        # text location in axes coords
        self.txt = ax.text( 0.7, 0.9, '', transform=ax.transAxes)

    def mouse_move(self, event):

        if not event.inaxes: return
        ax = event.inaxes
        minx, maxx = ax.get_xlim()
        miny, maxy = ax.get_ylim()

        x, y = event.xdata, event.ydata

        indx = searchsorted(self.x, [x])[0]
        x = self.x[indx]
        y = self.y[indx]
        # update the line positions
        self.lx.set_data( (minx, maxx), (y, y) )
        self.ly.set_data( (x, x), (miny, maxy) )

        self.txt.set_text( 'x=%1.2f, y=%1.2f'%(x,y) )
        print 'x=%1.2f, y=%1.2f'%(x,y)
        draw()

t = arange(0.0, 1.0, 0.01)
s = sin(2*2*pi*t)
ax = subplot(111)

cursor = Cursor(ax)
#cursor = SnaptoCursor(ax, t, s)
connect('motion_notify_event', cursor.mouse_move)

ax.plot(t, s, 'o')
axis([0,1,-1,1])
show()
点線を描画する
#!/usr/bin/env python

"""
You can precisely specify dashes with an on/off ink rect sequence in
points.
"""
from pylab import *

dashes = [5,2,10,5] # 5 points on, 2 off, 3 on, 1 off

l, = plot(arange(20), '--')
l.set_dashes(dashes)
savefig('dash_control')
show()

いろいろな線を描画する
#!/usr/bin/env python
from pylab import *

t = arange(0.0, 3.0, 0.05)
s = sin(2*pi*t)
styles = ('-', '--', ':', '.', 'o', '^', 'v', '<', '>', 's', '+')
colors = ('b', 'g', 'r', 'c', 'm', 'y', 'k')


axisNum = 0
for row in range(5):
    for col in range(4):
        s = sin(2*pi*t)
        axisNum += 1
        subplot(5,4,axisNum)
        style = styles[axisNum % len(styles) ]
        color = colors[axisNum % len(colors) ]
        plot(t,s, style + color)
        # turn off the ticklabels if not first row or first col
        if not gca().is_first_col():
            setp(gca(), 'yticklabels', [])
        if not gca().is_last_row():
            setp(gca(), 'xticklabels', [])

#savefig('line_styles', dpi=300)
show()

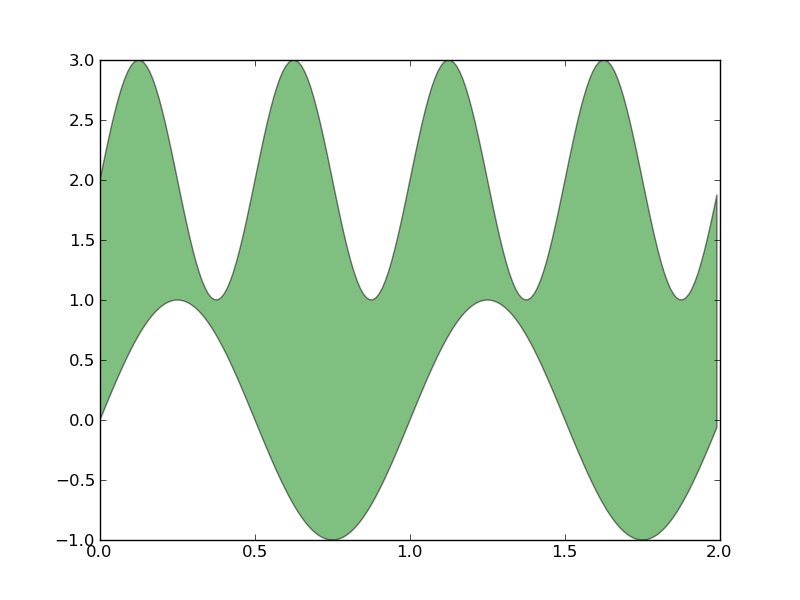
領域を塗りつぶす
#!/usr/bin/env python

from pylab import *

x1 = arange(0, 2, 0.01)
y1 = sin(2*pi*x1)
y2 = sin(4*pi*x1) + 2

# reverse x and y2 so the polygon fills in order
x = concatenate( (x1,x1[::-1]) )
y = concatenate( (y1,y2[::-1]) )

p = fill(x, y, facecolor='g', alpha=0.5)
show()
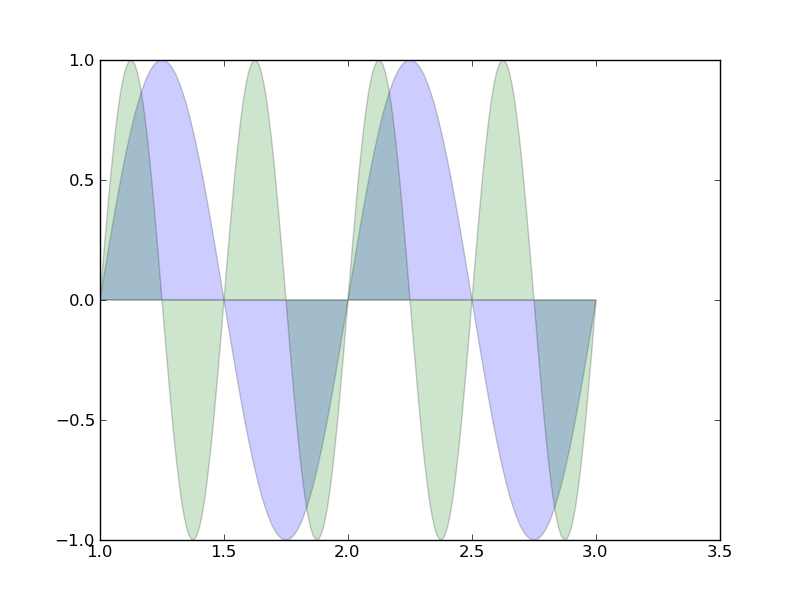
領域を塗りつぶす(透過)
- nxでエラー。nxってnetworkx?と思ってnetworkxを入れたけどエラー
- numpyで置き換え可?→OK
- なんか右の余白が大きいなあ
# from pylab import figure, nx, show
from pylab import figure, show
import numpy as nx
fig = figure()
ax = fig.add_subplot(111)
t = nx.arange(1.0,3.01,0.01)
s = nx.sin(2*nx.pi*t)
c = nx.sin(4*nx.pi*t)
ax.fill(t, s, 'b', t, c, 'g', alpha=0.2)
show()
複数のグラフを表示する
- conv(x,r)が無い → convolve(x,r)
#!/usr/bin/env python

from pylab import *

# create some data to use for the plot
dt = 0.001
t = arange(0.0, 10.0, dt)
r = exp(-t[:1000]/0.05)               # impulse response
x = randn(len(t))
## s = conv(x,r)[:len(x)]*dt  # colored noise
s = convolve(x,r)[:len(x)]*dt  # colored noise

# the main axes is subplot(111) by default
plot(t, s)
axis([0, 1, 1.1*amin(s), 2*amax(s) ])
xlabel('time (s)')
ylabel('current (nA)')
title('Gaussian colored noise')

# this is an inset axes over the main axes
a = axes([.65, .6, .2, .2], axisbg='y')
n, bins, patches = hist(s, 400, normed=1)
title('Probability')
setp(a, xticks=[], yticks=[])

# this is another inset axes over the main axes
a = axes([0.2, 0.6, .2, .2], axisbg='y')
plot(t[:len(r)], r)
title('Impulse response')
setp(a, xlim=(0,.2), xticks=[], yticks=[])

#savefig('../figures/axes_demo.eps')
#savefig('../figures/axes_demo.png')
show()

1軸共通のグラフを重ねて書く
#!/usr/bin/env python
"""
To create plots that share a common axes (visually) you can set the
hspace bewtween the subplots close to zero (do not use zero itself).
Normally you'll want to turn off the tick labels on all but one of the
axes.

In this example the plots share a common xaxis but you can follow the
same logic to supply a common y axis.
"""
from pylab import *

t = arange(0.0, 2.0, 0.01)

s1 = sin(2*pi*t)
s2 = exp(-t)
s3 = s1*s2

# axes rect in relative 0,1 coords left, bottom, width, height.  Turn
# off xtick labels on all but the lower plot


f = figure()
subplots_adjust(hspace=0.001)


ax1 = subplot(311)
ax1.plot(t,s1)
yticks(arange(-0.9, 1.0, 0.4))
ylim(-1,1)

ax2 = subplot(312, sharex=ax1)
ax2.plot(t,s2)
yticks(arange(0.1, 1.0,  0.2))
ylim(0,1)

ax3 = subplot(313, sharex=ax1)
ax3.plot(t,s3)
yticks(arange(-0.9, 1.0, 0.4))
ylim(-1,1)

xticklabels = ax1.get_xticklabels()+ax2.get_xticklabels()
setp(xticklabels, visible=False)

show()

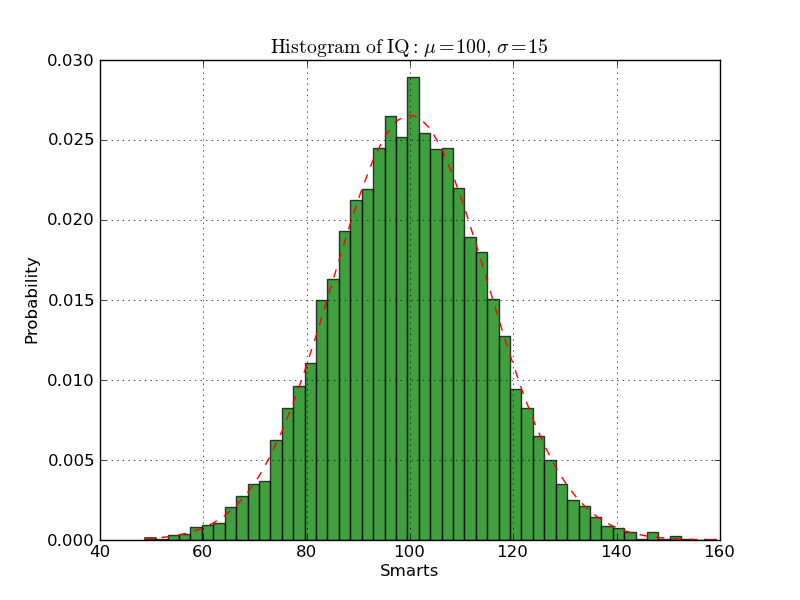
ヒストグラムを描画する
#!/usr/bin/env python
from pylab import *

mu, sigma = 100, 15
x = mu + sigma*randn(10000)

# the histogram of the data
n, bins, patches = hist(x, 50, normed=1)
setp(patches, 'facecolor', 'g', 'alpha', 0.75)

# add a 'best fit' line
y = normpdf( bins, mu, sigma)
l = plot(bins, y, 'r--')
setp(l, 'linewidth', 1)

xlabel('Smarts')
ylabel('Probability')
title(r'$\rm{Histogram\ of\ IQ:}\ \mu=100,\ \sigma=15$')
axis([40, 160, 0, 0.03])
grid(True)

#savefig('histogram_demo',dpi=72)
show()
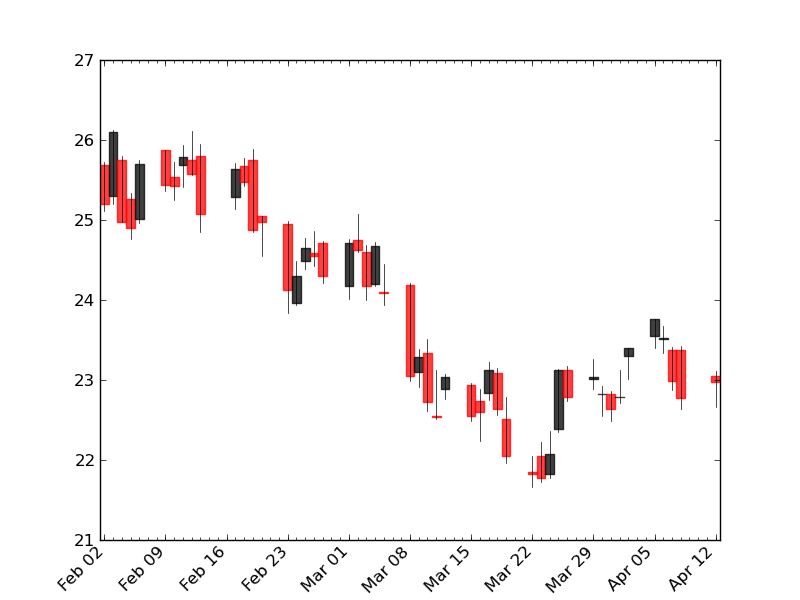
ローソク足を描画する
- timezoneが無いって言われた(が、使われていないっぽいのでコメントアウト)
from pylab import *

from matplotlib.dates import  DateFormatter, WeekdayLocator, HourLocator, \
     DayLocator, MONDAY ##, timezone
from matplotlib.finance import quotes_historical_yahoo, candlestick,\
     plot_day_summary, candlestick2

import datetime

date1 = datetime.date( 2004, 2, 1)
date2 = datetime.date( 2004, 4, 12 )


mondays = WeekdayLocator(MONDAY)        # major ticks on the mondays
alldays    = DayLocator()               # minor ticks on the days
weekFormatter = DateFormatter('%b %d')  # Eg, Jan 12
dayFormatter = DateFormatter('%d')      # Eg, 12

quotes = quotes_historical_yahoo(
    'INTC', date1, date2)
if not quotes:
    raise SystemExit

print quotes

ax = subplot(111)
ax.xaxis.set_major_locator(mondays)
ax.xaxis.set_minor_locator(alldays)
ax.xaxis.set_major_formatter(weekFormatter)
#ax.xaxis.set_minor_formatter(dayFormatter)

#plot_day_summary(ax, quotes, ticksize=3)
candlestick(ax, quotes, width=1 ,alpha =0.75)

setp( gca().get_xticklabels(), rotation=45, horizontalalignment='right')

show()
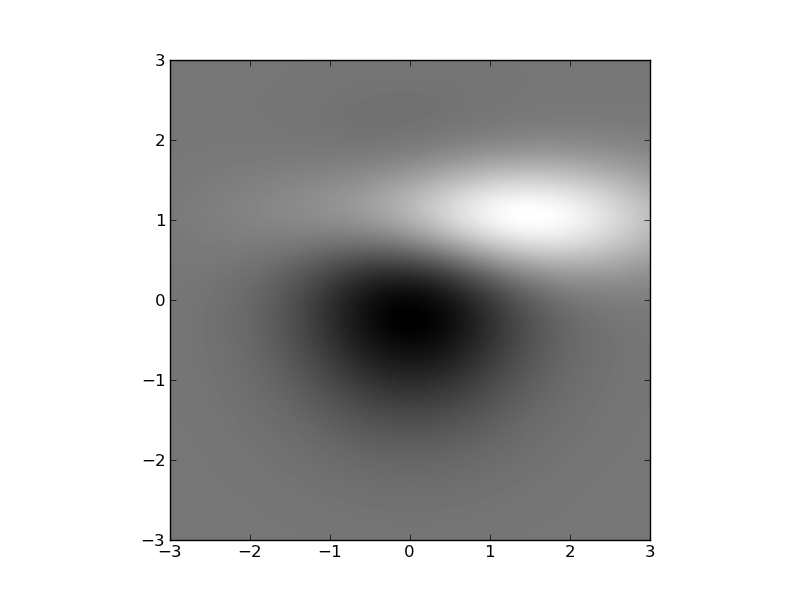
濃淡画像を描画する
#!/usr/bin/env python
from pylab import *

delta = 0.025
x = y = arange(-3.0, 3.0, delta)
X, Y = meshgrid(x, y)
Z1 = bivariate_normal(X, Y, 1.0, 1.0, 0.0, 0.0)
Z2 = bivariate_normal(X, Y, 1.5, 0.5, 1, 1)
Z = Z2-Z1  # difference of Gaussians

im = imshow(Z, interpolation='bilinear', cmap=cm.gray,
            origin='lower', extent=[-3,3,-3,3])

savefig('image_demo')
show()
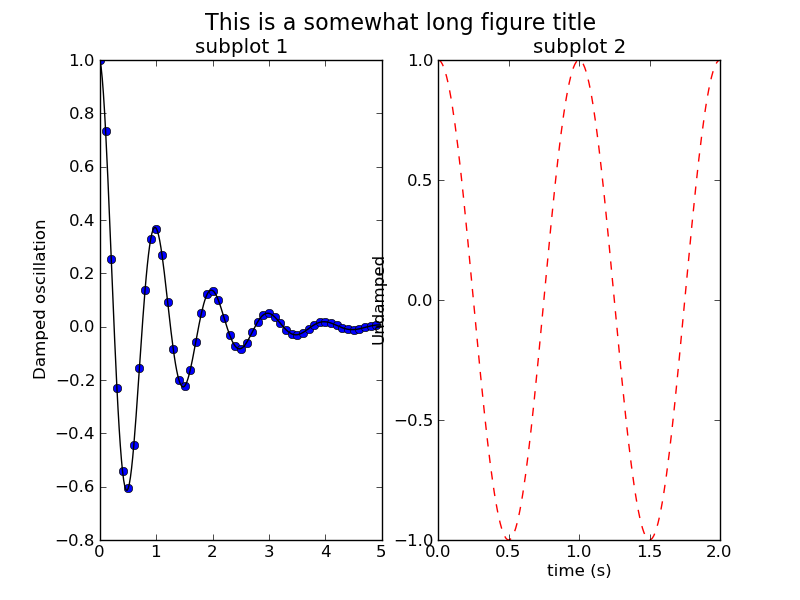
長いタイトルを描画する
#!/usr/bin/env python
from matplotlib.font_manager import FontProperties
from pylab import *

def f(t):
    s1 = cos(2*pi*t)
    e1 = exp(-t)
    return multiply(s1,e1)

t1 = arange(0.0, 5.0, 0.1)
t2 = arange(0.0, 5.0, 0.02)
t3 = arange(0.0, 2.0, 0.01)


subplot(121)
plot(t1, f(t1), 'bo', t2, f(t2), 'k')
title('subplot 1')
ylabel('Damped oscillation')
figtitle = 'This is a somewhat long figure title'
t = gcf().text(0.5, 0.95, figtitle,
               horizontalalignment='center',
               fontproperties=FontProperties(size=16))


subplot(122)
plot(t3, cos(2*pi*t3), 'r--')
xlabel('time (s)')
title('subplot 2')
ylabel('Undamped')

#savefig('figtext')
show()
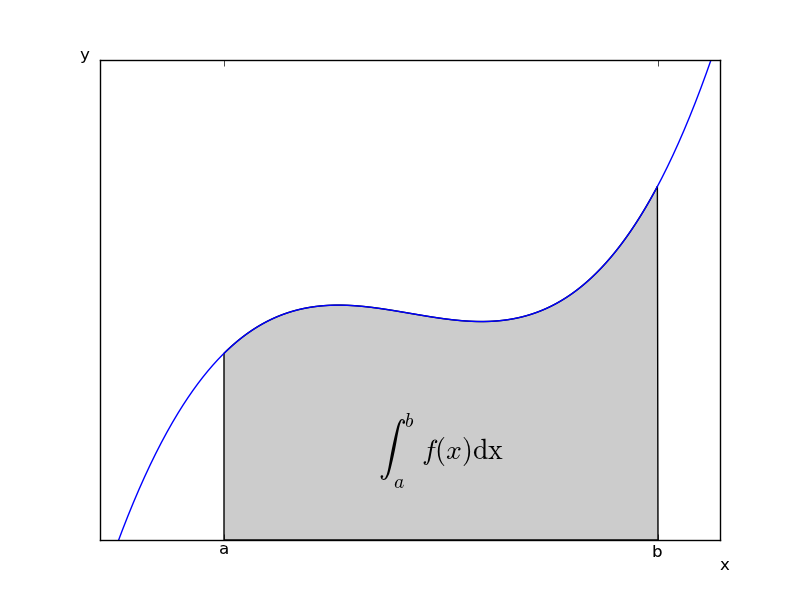
数式を描画する
#!/usr/bin/env python

# implement the example graphs/integral from pyx
from pylab import *
from matplotlib.patches import Polygon

def func(x):
    return (x-3)*(x-5)*(x-7)+85

ax = subplot(111)

a, b = 2, 9 # integral area
x = arange(0, 10, 0.01)
y = func(x)
plot(x, y, linewidth=1)

# make the shaded region
ix = arange(a, b, 0.01)
iy = func(ix)
verts = [(a,0)] + zip(ix,iy) + [(b,0)]
## poly = Polygon(verts, facecolor=0.8, edgecolor='k')  #これだとエラー
poly = Polygon(verts, facecolor=[0.8,0.8,0.8], edgecolor='k')
ax.add_patch(poly)

text(0.5 * (a + b), 30,
     r"$\int_a^b f(x)\rm{d}x$", horizontalalignment='center',
     fontsize=20)

axis([0,10, 0, 180])
figtext(0.9, 0.05, 'x')
figtext(0.1, 0.9, 'y')
ax.set_xticks((a,b))
ax.set_xticklabels(('a','b'))
ax.set_yticks([])
#savefig('integral_demo')
show()
数式を入力する
- TeXのフォント切替えがいまいちなので明示的に\itを指定してみた
#!/usr/bin/env python
"""

In order to use mathtext, you must build matplotlib.ft2font.  This is
built by default in the windows installer.

For other platforms, edit setup.py and set

BUILD_FT2FONT = True

"""
from pylab import *
subplot(111, axisbg='y')
plot([1,2,3], 'r')
x = arange(0.0, 3.0, 0.1)

grid(True)
xlabel(r'$\Delta_i^j$', fontsize=20)
ylabel(r'$\Delta_{i+1}^j$', fontsize=20)
## tex = r'$\cal{R}\prod_{i=\alpha_{i+1}}^\infty a_i\rm{sin}(2 \pi f x_i)$'
tex = r'$\cal{R}\prod_{\it{i}=\alpha_{i+1}}^\infty {\it a_i}\rm{sin}(2 \pi \it{f x_i})$'
text(1, 1.6, tex, fontsize=20)

savefig('mathtext_demo')

show()

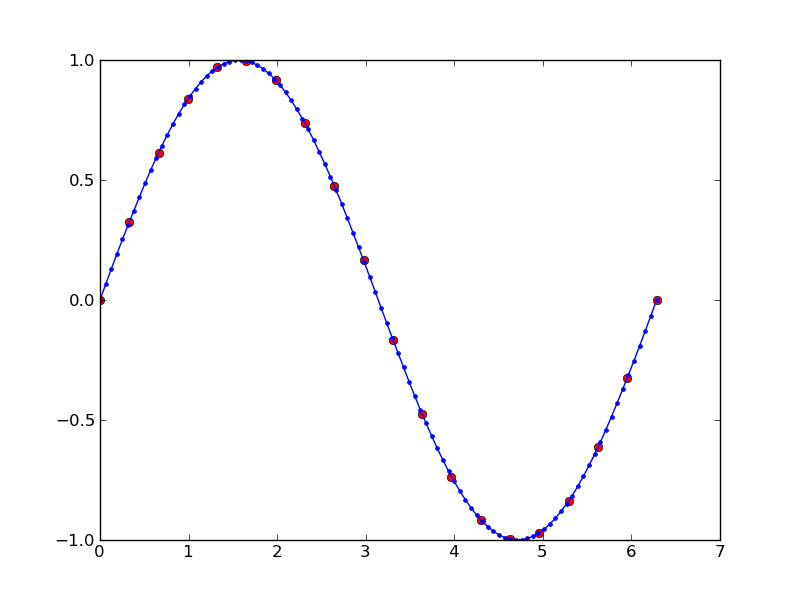
データを補間する
- pylab.nxの代わりにnumpyをnxとして
## from pylab import figure, show, nx, linspace, stineman_interp
from pylab import figure, show, linspace, stineman_interp
import numpy as nx
x = linspace(0,2*nx.pi,20);
y = nx.sin(x); yp = None
xi = linspace(x[0],x[-1],100);
yi = stineman_interp(xi,x,y,yp);

fig = figure()
ax = fig.add_subplot(111)
ax.plot(x,y,'ro',xi,yi,'-b.')
show()
軸の増加方向を反転する
#!/usr/bin/env python
"""

You can use decreasing axes by flipping the normal order of the axis
limits

"""
from pylab import *

t = arange(0.01, 5.0, 0.01)
s = exp(-t)
plot(t, s)

xlim(5,0)  # decreasing time

xlabel('decreasing time (s)')
ylabel('voltage (mV)')
title('Should be growing...')
grid(True)

show()

画像を重ねて描画する
#!/usr/bin/env python
"""
Layer images above one another using alpha blending
"""
from __future__ import division
from pylab import *

def func3(x,y):
    return (1- x/2 + x**5 + y**3)*exp(-x**2-y**2)

# make these smaller to increase the resolution
dx, dy = 0.05, 0.05

x = arange(-3.0, 3.0, dx)
y = arange(-3.0, 3.0, dy)
X,Y = meshgrid(x, y)

# when layering multiple images, the images need to have the same
# extent.  This does not mean they need to have the same shape, but
# they both need to render to the same coordinate system determined by
# xmin, xmax, ymin, ymax.  Note if you use different interpolations
# for the images their apparent extent could be different due to
# interpolation edge effects


xmin, xmax, ymin, ymax = amin(x), amax(x), amin(y), amax(y)
extent = xmin, xmax, ymin, ymax
Z1 = array(([0,1]*4 + [1,0]*4)*4); Z1.shape = 8,8  # chessboard
im1 = imshow(Z1, cmap=cm.gray, interpolation='nearest',
             extent=extent)
hold(True)

Z2 = func3(X, Y)

im2 = imshow(Z2, cmap=cm.jet, alpha=.9, interpolation='bilinear',
             extent=extent)
#axis([xmin, xmax, ymin, ymax])


#savefig('layer_images')

show()

対数グラフ
#!/usr/bin/env python
from pylab import *

dt = 0.01
t = arange(dt, 20.0, dt)

subplot(311)
semilogy(t, exp(-t/5.0))
ylabel('semilogy')
grid(True)

subplot(312)
semilogx(t, sin(2*pi*t))
ylabel('semilogx')


grid(True)
gca().xaxis.grid(True, which='minor')  # minor grid on too

subplot(313)
loglog(t, 20*exp(-t/10.0), basex=4)
grid(True)
ylabel('loglog base 4 on x')
savefig('log_demo')
show()

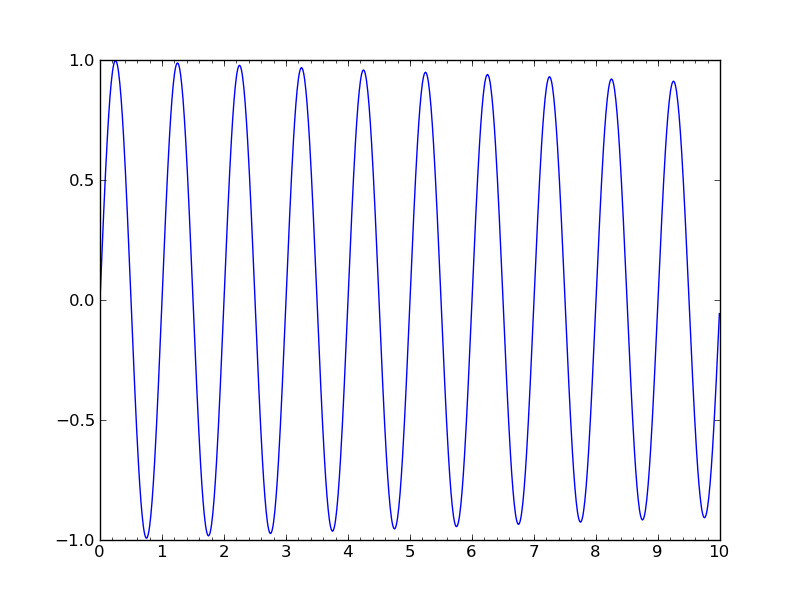
目盛りを描画する
#!/usr/bin/env python
"""
Set the major ticks on the ints and minor ticks on multiples of 0.2
"""

from pylab import *
from matplotlib.ticker import MultipleLocator, FormatStrFormatter

majorLocator   = MultipleLocator(1)
majorFormatter = FormatStrFormatter('%d')
minorLocator   = MultipleLocator(.2)


t = arange(0.0, 10.0, 0.01)
s = sin(2*pi*t)*exp(-t*0.01)

ax = subplot(111)
plot(t,s)

ax.xaxis.set_major_locator(majorLocator)
ax.xaxis.set_major_formatter(majorFormatter)

#for the minor ticks, use no labels; default NullFormatter
ax.xaxis.set_minor_locator(minorLocator)

show()
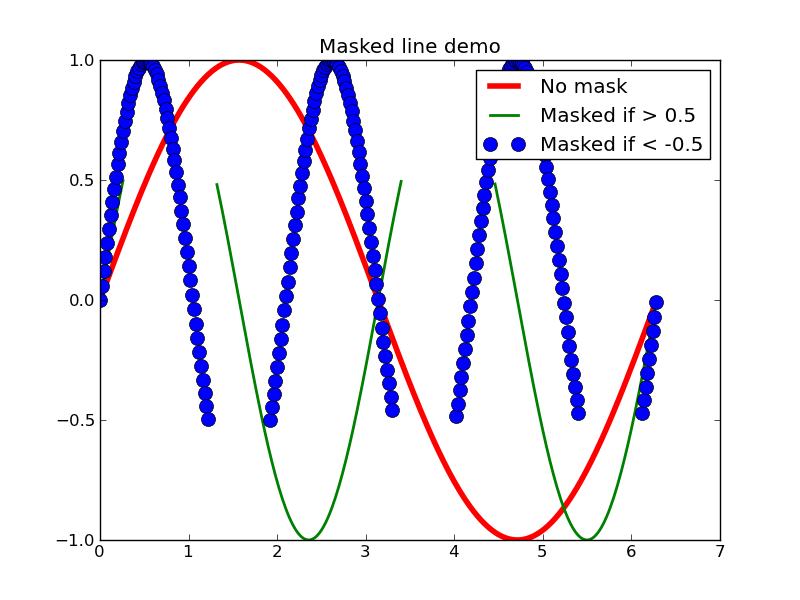
グラフにマスクをかける
- matplotlib.numerix.ma → numpy.ma
#!/bin/env python
'''
Plot lines with points masked out.

This would typically be used with gappy data, to
break the line at the data gaps.
'''

## import matplotlib.numerix.ma as M
import numpy.ma as M
from pylab import *

x = M.arange(0, 2*pi, 0.02)
y = M.sin(x)
y1 = sin(2*x)
y2 = sin(3*x)
ym1 = M.masked_where(y1 > 0.5, y1)
ym2 = M.masked_where(y2 < -0.5, y2)

lines = plot(x, y, 'r', x, ym1, 'g', x, ym2, 'bo')
setp(lines[0], linewidth = 4)
setp(lines[1], linewidth = 2)
setp(lines[2], markersize = 10)

legend( ('No mask', 'Masked if > 0.5', 'Masked if < -0.5') ,
        loc = 'upper right')
title('Masked line demo')
show()
密度プロットを描画する
#!/usr/bin/env python
"""
See pcolor_demo2 for an alternative way of generating pcolor plots
using imshow that is likely faster for large grids
"""
from __future__ import division
from matplotlib.patches import Patch
from pylab import *

def func3(x,y):
    return (1- x/2 + x**5 + y**3)*exp(-x**2-y**2)


# make these smaller to increase the resolution
dx, dy = 0.05, 0.05

x = arange(-3.0, 3.0001, dx)
y = arange(-3.0, 3.0001, dy)
X,Y = meshgrid(x, y)

Z = func3(X, Y)
pcolor(X, Y, Z, shading='flat')
colorbar()
axis([-3,3,-3,3])
savefig('pcolor_demo')
show()

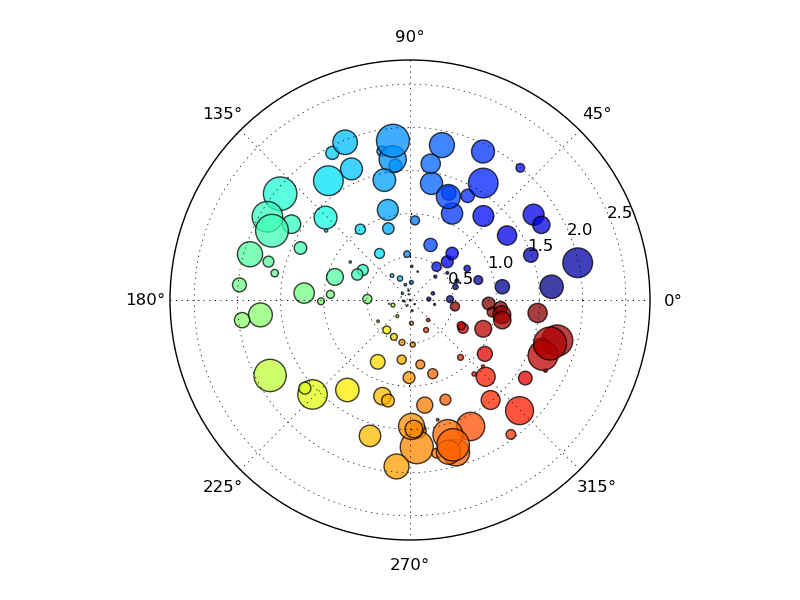
極座標系で描画する
#!/usr/bin/env python
# a polar scatter plot; size increases radially in this example and
# color increases with angle (just to verify the symbols are being
# scattered correctlu).  In a real example, this would be wasting
# dimensionlaity of the plot
from pylab import *

N = 150
r = 2*rand(N)
theta = 2*pi*rand(N)
area = 200*r**2*rand(N)
colors = theta
ax = subplot(111, polar=True)
c = scatter(theta, r, c=colors, s=area)
c.set_alpha(0.75)

#savefig('polar_test2')
show()
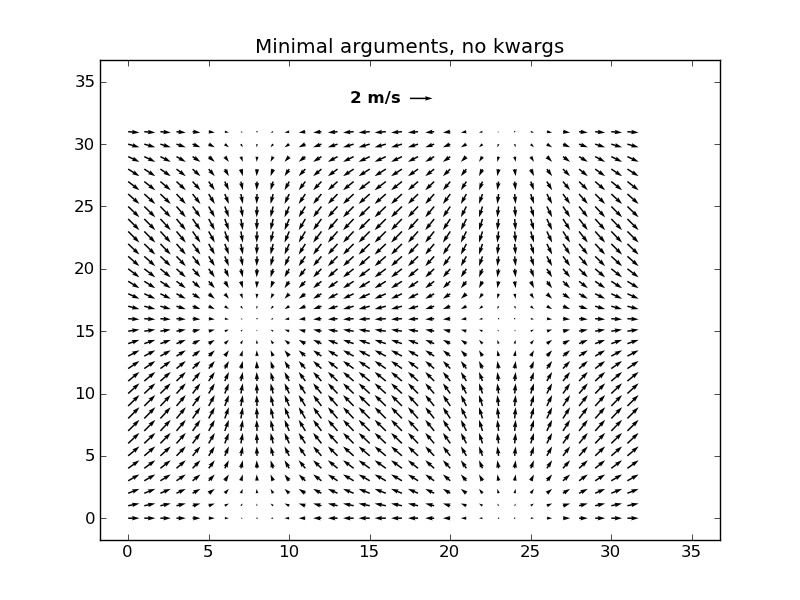
ベクトル場を描画する
'''
Demonstration of quiver and quiverkey functions. This is using the
new version coming from the code in quiver.py.

Known problem: the plot autoscaling does not take into account
the arrows, so those on the boundaries are often out of the picture.
This is *not* an easy problem to solve in a perfectly general way.
The workaround is to manually expand the axes.

'''
from pylab import *

X,Y = meshgrid( arange(0,2*pi,.2),arange(0,2*pi,.2) )
U = cos(X)
V = sin(Y)

#1
figure()
Q = quiver( U, V)
qk = quiverkey(Q, 0.5, 0.92, 2, '2 m/s', labelpos='W',
                    fontproperties={'weight': 'bold'})
l,r,b,t = axis()
dx, dy = r-l, t-b
axis([l-0.05*dx, r+0.05*dx, b-0.05*dy, t+0.05*dy])

title('Minimal arguments, no kwargs')
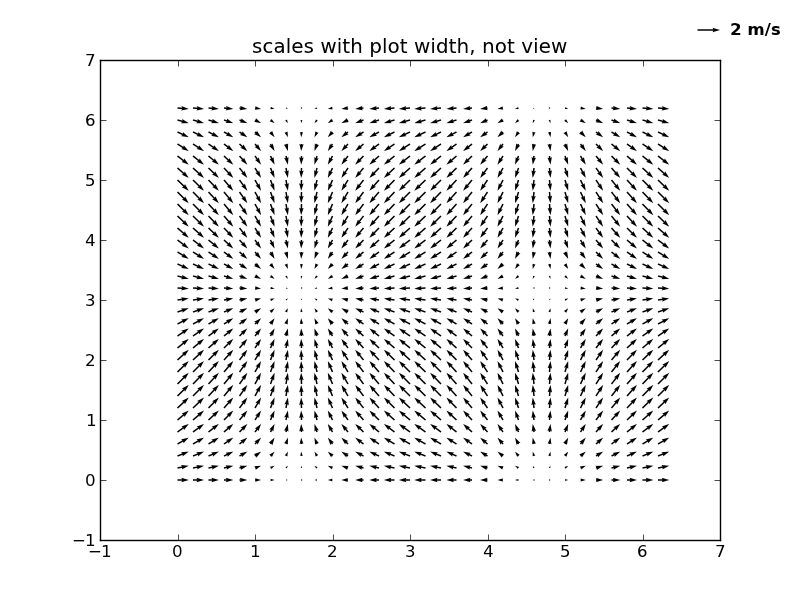
#2
figure()
Q = quiver( X, Y, U, V, units='width')
qk = quiverkey(Q, 0.9, 0.95, 2, '2 m/s',
                            labelpos='E',
                            coordinates='figure',
                            fontproperties={'weight': 'bold'})
axis([-1, 7, -1, 7])
title('scales with plot width, not view')
#3
figure()
Q = quiver( X[::3, ::3], Y[::3, ::3], U[::3, ::3], V[::3, ::3],
            pivot='mid', color='r', units='inches' )
qk = quiverkey(Q, 0.5, 0.03, 1, '1 m/s', fontproperties={'weight': 'bold'})
plot( X[::3, ::3], Y[::3, ::3], 'k.')
axis([-1, 7, -1, 7])
title("pivot='mid'; every third arrow; units='inches'")

#4
figure()
M = sqrt(pow(U, 2) + pow(V, 2))
Q = quiver( X, Y, U, V, M, units='x', pivot='tip', width=0.022, scale=1/0.15)
qk = quiverkey(Q, 0.9, 1.05, 1, '1 m/s',
                            labelpos='E',
                            fontproperties={'weight': 'bold'})
plot(X, Y, 'k.')
axis([-1, 7, -1, 7])
title("scales with x view; pivot='tip'")

#5
figure()
Q = quiver( X[::3, ::3], Y[::3, ::3], U[::3, ::3], V[::3, ::3],
             color='r', units='x',
            linewidths=(2,), edgecolors=('k'), headaxislength=5 )
qk = quiverkey(Q, 0.5, 0.03, 1, '1 m/s', fontproperties={'weight': 'bold'})
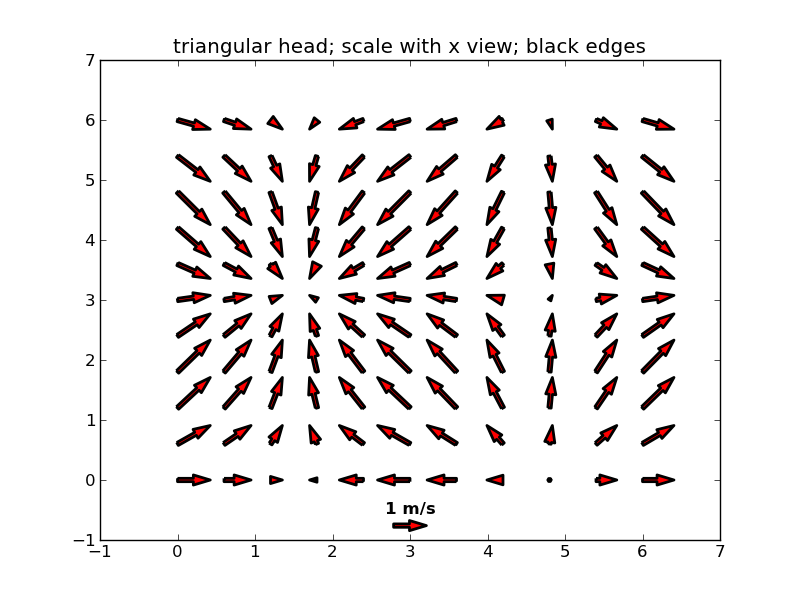
axis([-1, 7, -1, 7])
title("triangular head; scale with x view; black edges")


show()
散布図を描画する
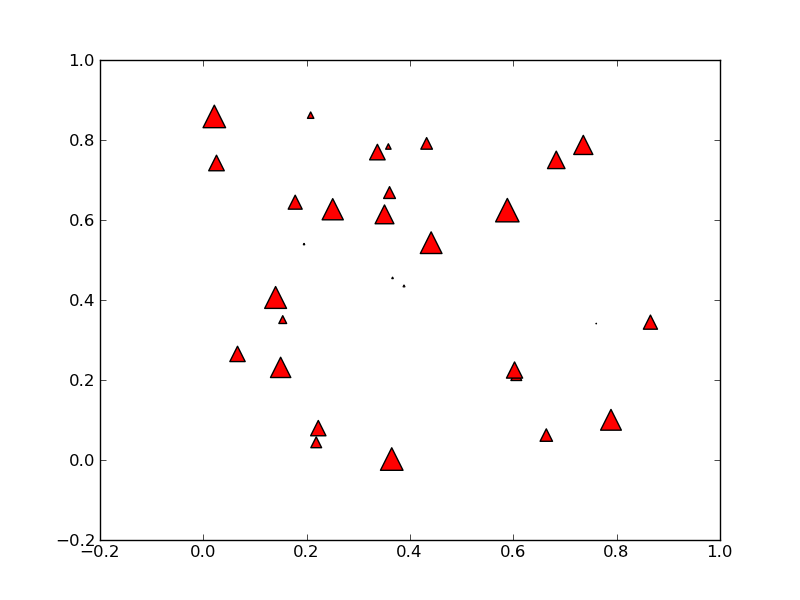
#!/usr/bin/env python
from pylab import *

N = 30
x = 0.9*rand(N)
y = 0.9*rand(N)
area = pi*(10 * rand(N))**2 # 0 to 10 point radiuses
scatter(x,y,s=area, marker='^', c='r')
savefig('scatter_demo')

show()
パワースペクトルを求める
- conv()がない → convolve()
#!/usr/bin/env python
# python

from pylab import *

dt = 0.01
t = arange(0,10,dt)
nse = randn(len(t))
r = exp(-t/0.05)

## cnse = conv(nse, r)*dt
cnse = convolve(nse, r)*dt
cnse = cnse[:len(t)]
s = 0.1*sin(2*pi*t) + cnse

subplot(211)
plot(t,s)
subplot(212)
psd(s, 512, 1/dt)

show()

2次元パワースペクトルを描画する
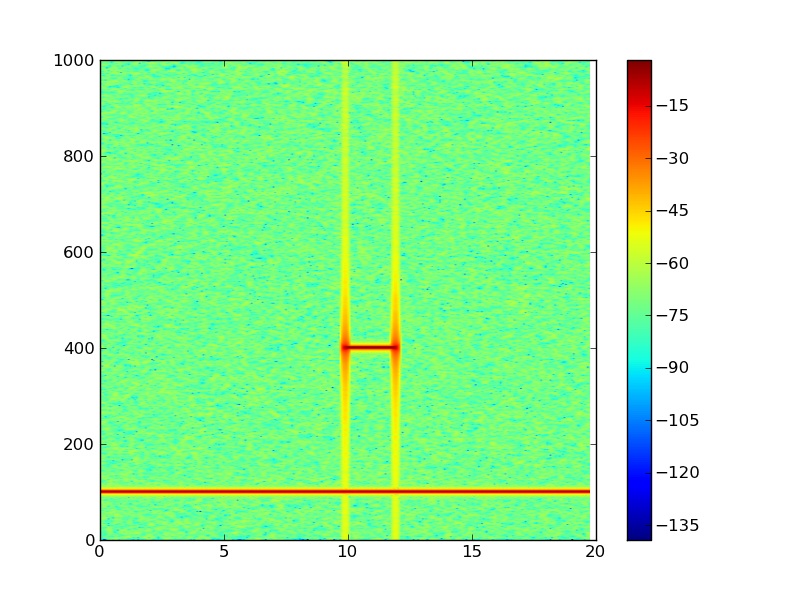
#!/usr/bin/env python
from pylab import *

dt = 0.0005
t = arange(0.0, 20.0, dt)
s1 = sin(2*pi*100*t)
s2 = 2*sin(2*pi*400*t)

# create a transient "chirp"
mask = where(logical_and(t>10, t<12), 1.0, 0.0)
s2 = s2 * mask

# add some noise into the mix
nse = 0.01*randn(len(t))

x = s1 + s2 + nse # the signal
NFFT = 1024       # the length of the windowing segments
Fs = int(1.0/dt)  # the sampling frequency

# Pxx is the segments x freqs array of instantaneous power, freqs is
# the frequency vector, bins are the centers of the time bins in which
# the power is computed, and im is the matplotlib.image.AxesImage
# instance
Pxx, freqs, bins, im = specgram(x, NFFT=NFFT, Fs=Fs, noverlap=900)
colorbar()
show()
Y方向の残差を描画する。
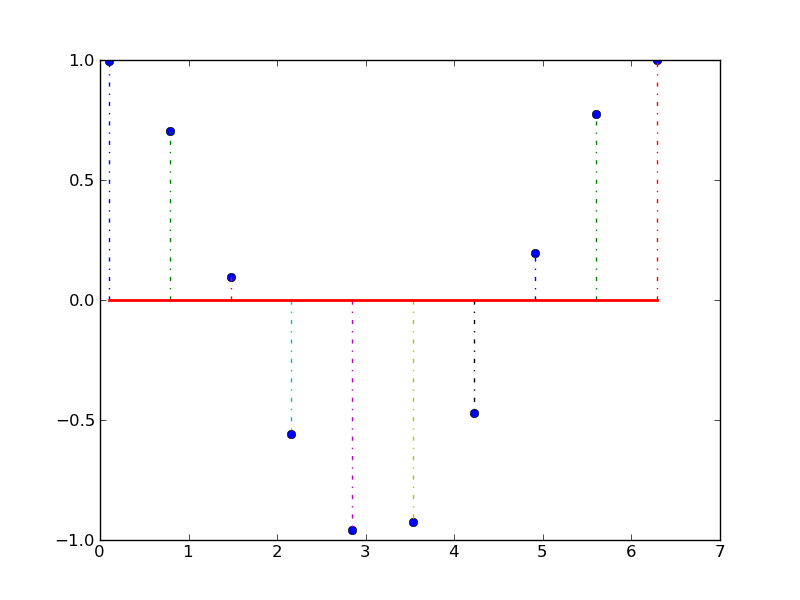
#!/usr/bin/env python
from pylab import *

x = linspace(0.1, 2*pi, 10)
markerline, stemlines, baseline = stem(x, cos(x), '-.')
setp(markerline, 'markerfacecolor', 'b')
setp(baseline, 'color','r', 'linewidth', 2)

show()
表を描画する
- colours無い
#!/usr/bin/env python
import matplotlib

from pylab import *
from colours import get_colours

axes([0.2, 0.2, 0.7, 0.6])   # leave room below the axes for the table

data = [[  66386,  174296,   75131,  577908,   32015],
        [  58230,  381139,   78045,   99308,  160454],
        [  89135,   80552,  152558,  497981,  603535],
        [  78415,   81858,  150656,  193263,   69638],
        [ 139361,  331509,  343164,  781380,   52269]]

colLabels = ('Freeze', 'Wind', 'Flood', 'Quake', 'Hail')
rowLabels = ['%d year' % x for x in (100, 50, 20, 10, 5)]

# Get some pastel shades for the colours
colours = get_colours(len(colLabels))
colours.reverse()
rows = len(data)

ind = arange(len(colLabels)) + 0.3  # the x locations for the groups
cellText = []
width = 0.4     # the width of the bars
yoff = array([0.0] * len(colLabels)) # the bottom values for stacked bar chart
for row in xrange(rows):
    bar(ind, data[row], width, bottom=yoff, color=colours[row])
    yoff = yoff + data[row]
    cellText.append(['%1.1f' % (x/1000.0) for x in yoff])

# Add a table at the bottom of the axes
colours.reverse()
cellText.reverse()
the_table = table(cellText=cellText,
                  rowLabels=rowLabels, rowColours=colours,
                  colLabels=colLabels,
                  loc='bottom')
ylabel("Loss $1000's")
vals = arange(0, 2500, 500)
yticks(vals*1000, ['%d' % val for val in vals])
xticks([])
title('Loss by Disaster')
#savefig('table_demo_small', dpi=75)
#savefig('table_demo_large', dpi=300)

show()
matplotlib/doc/mpl_examples/pylab_examples/colours.py
#!/usr/bin/env python
# -*- noplot -*-
"""
Some simple functions to generate colours.
"""
import numpy as np
from matplotlib.colors import colorConverter

def pastel(colour, weight=2.4):
    """ Convert colour into a nice pastel shade"""
    rgb = np.asarray(colorConverter.to_rgb(colour))
    # scale colour
    maxc = max(rgb)
    if maxc < 1.0 and maxc > 0:
        # scale colour
        scale = 1.0 / maxc
        rgb = rgb * scale
    # now decrease saturation
    total = rgb.sum()
    slack = 0
    for x in rgb:
        slack += 1.0 - x

    # want to increase weight from total to weight
    # pick x s.t.  slack * x == weight - total
    # x = (weight - total) / slack
    x = (weight - total) / slack

    rgb = [c + (x * (1.0-c)) for c in rgb]

    return rgb

def get_colours(n):
    """ Return n pastel colours. """
    base = np.asarray([[1,0,0], [0,1,0], [0,0,1]])

    if n <= 3:
        return base[0:n]

    # how many new colours to we need to insert between
    # red and green and between green and blue?
    needed = (((n - 3) + 1) / 2, (n - 3) / 2)

    colours = []
    for start in (0, 1):
        for x in np.linspace(0, 1, needed[start]+2):
            colours.append((base[start] * (1.0 - x)) +
                           (base[start+1] * x))

    return [pastel(c) for c in colours[0:n]]

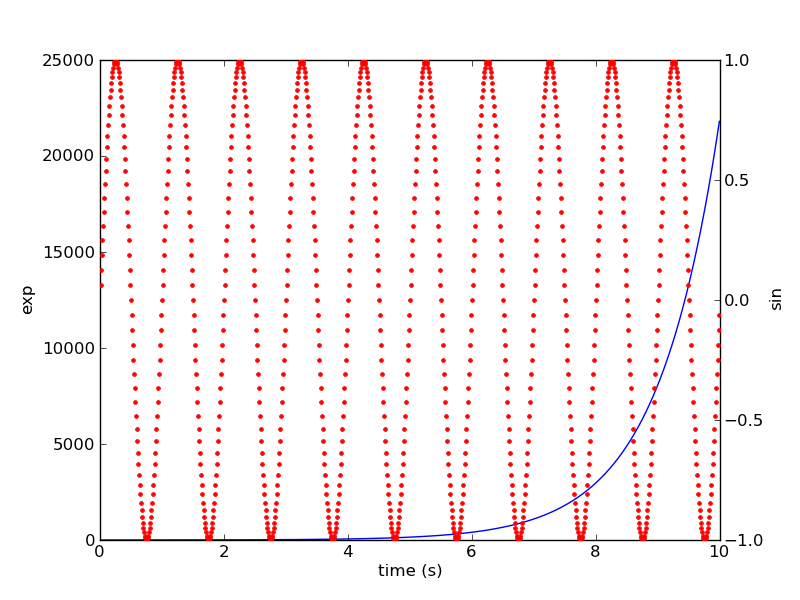
2つの軸をもつグラフを描画する
#!/usr/bin/env python
"""

Demonstrate how to do two plots on the same axes with different left
right scales.


The trick is to use *2 different axes*.  Turn the axes rectangular
frame off on the 2nd axes to keep it from obscuring the first.
Manually set the tick locs and labels as desired.  You can use
separate matplotlib.ticker formatters and locators as desired since
the two axes are independent.

This is acheived in the following example by calling pylab's twinx()
function, which performs this work. See the source of twinx() in
pylab.py for an example of how to do it for different x scales. (Hint:
use the xaxis instance and call tick_bottom and tick_top in place of
tick_left and tick_right.)

"""

from pylab import *

ax1 = subplot(111)
t = arange(0.01, 10.0, 0.01)
s1 = exp(t)
plot(t, s1, 'b-')
xlabel('time (s)')
ylabel('exp')


# turn off the 2nd axes rectangle with frameon kwarg
ax2 = twinx()
s2 = sin(2*pi*t)
plot(t, s2, 'r.')
ylabel('sin')
ax2.yaxis.tick_right()
show()
垂直線を描画する
- matplotlib.numerix → numpy
- matplotlib.numerix.random_array → numpy.random
#!/usr/bin/env python
from pylab import *
## from matplotlib.numerix import sin, exp, multiply, absolute, pi
## from matplotlib.numerix.random_array import normal
from numpy import sin, exp, multiply, absolute, pi
from numpy.random import normal

def f(t):
    s1 = sin(2*pi*t)
    e1 = exp(-t)
    return absolute(multiply(s1,e1))+.05


t = arange(0.0, 5.0, 0.1)
s = f(t)
nse = multiply(normal(0.0, 0.3, t.shape), s)

plot(t, s+nse, 'b^')
vlines(t, [0], s)
xlabel('time (s)')
title('Comparison of model with data')
show()

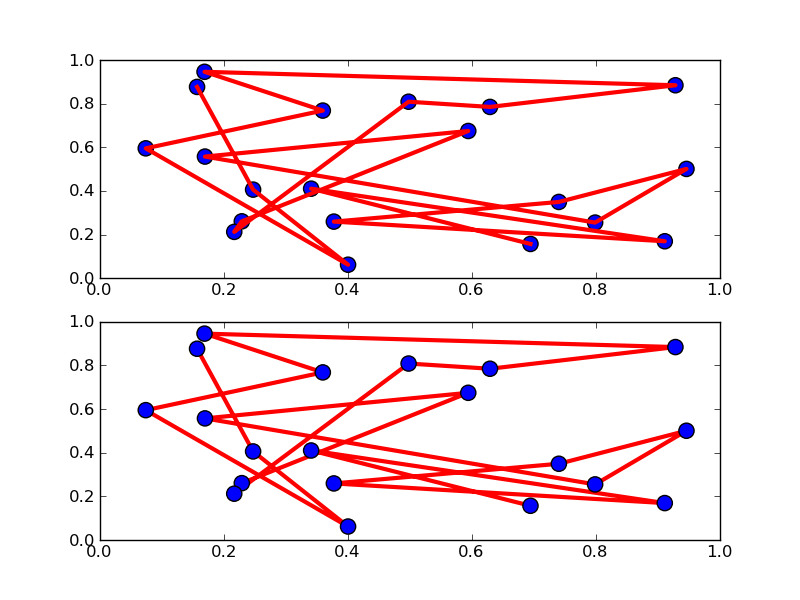
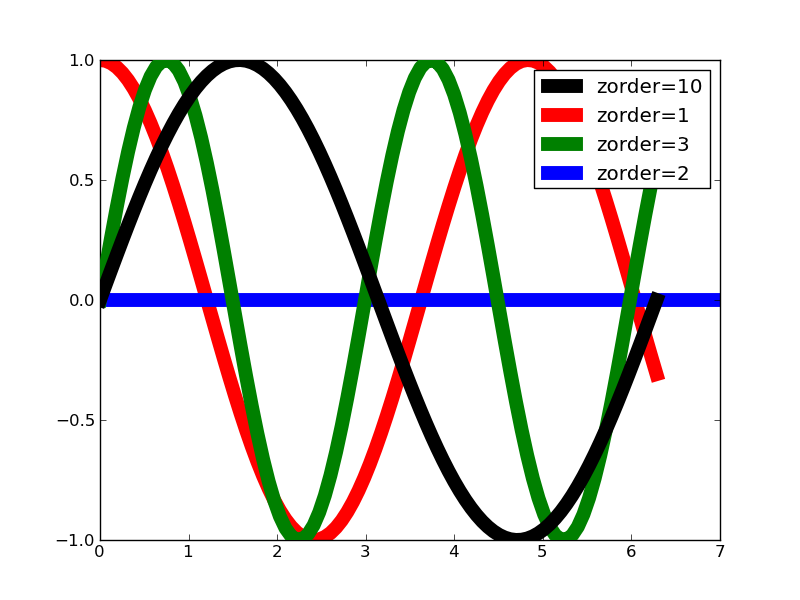
描画する順番を入れ替える
#!/usr/bin/env python
"""
The default drawing order for axes is patches, lines, text.  This
order is determined by the zorder attribute.  The following defaults
are set

Artist                      Z-order
Patch / PatchCollection      1
Line2D / LineCollection      2
Text                         3

You can change the order for individual artists by setting the zorder.  Any
individual plot() call can set a value for the zorder of that particular item.

In the fist subplot below, the lines are drawn above the patch
collection from the scatter, which is the default.

In the subplot below, the order is reversed.

The second figure shows how to control the zorder of individual lines.
"""

from pylab import *
x = rand(20); y = rand(20)

subplot(211)
plot(x, y, 'r', lw=3)
scatter(x,y,s=120)

subplot(212)
plot(x, y, 'r', zorder=1, lw=3)
scatter(x,y,s=120, zorder=2)

# A new figure, with individually ordered items
x=frange(0,2*pi,npts=100)
figure()
plot(x,sin(x),linewidth=10, color='black',label='zorder=10',zorder = 10)  # on top
plot(x,cos(1.3*x),linewidth=10, color='red', label='zorder=1',zorder = 1) # bottom
plot(x,sin(2.1*x),linewidth=10, color='green', label='zorder=3',zorder = 3)
axhline(0,linewidth=10, color='blue', label='zorder=2',zorder = 2)
l = legend()
l.set_zorder(20) # put the legend on top

show()
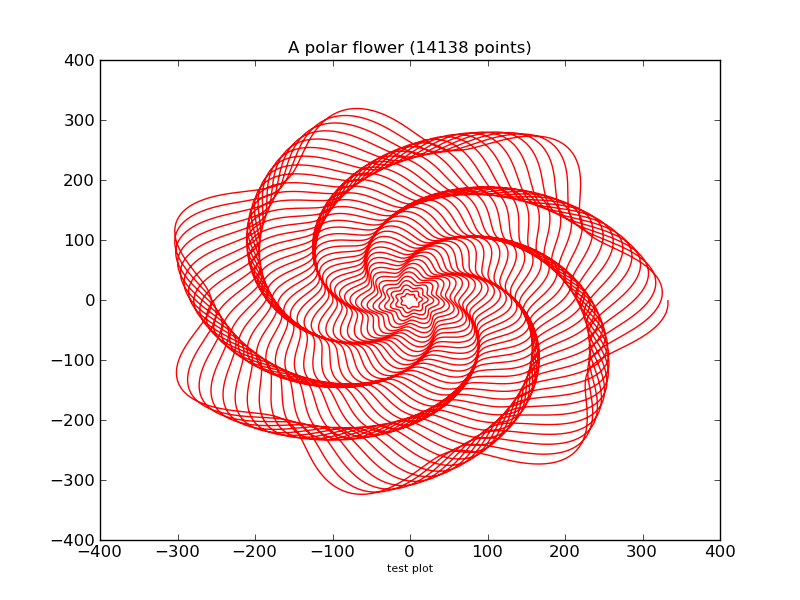
これは何だろう
- 「matplotlibをwxPythonで利用する」の描画内容
from pylab import *
from numpy import *

theta = arange(0, 45*2*pi, 0.02)
rad = (0.8*theta/(2*pi)+1)
r = rad*(8 + sin(theta*7+rad/1.8))
x = r*cos(theta)
y = r*sin(theta)

# Now draw it
plot(x,y, '-r')
# Set some plot attributes
title("A polar flower (%s points)"%len(x), fontsize = 12)
xlabel("test plot", fontsize = 8)
xlim([-400, 400])
ylim([-400, 400])

show()
http://toranekosan.blogspot.com/2007_09_30_archive.html より
- またまたpythonで! http://toranekosan.blogspot.com/2007/10/python.html
- pythonでMatplotlib使おう! http://toranekosan.blogspot.com/2007/10/pythonmatplotlib.html
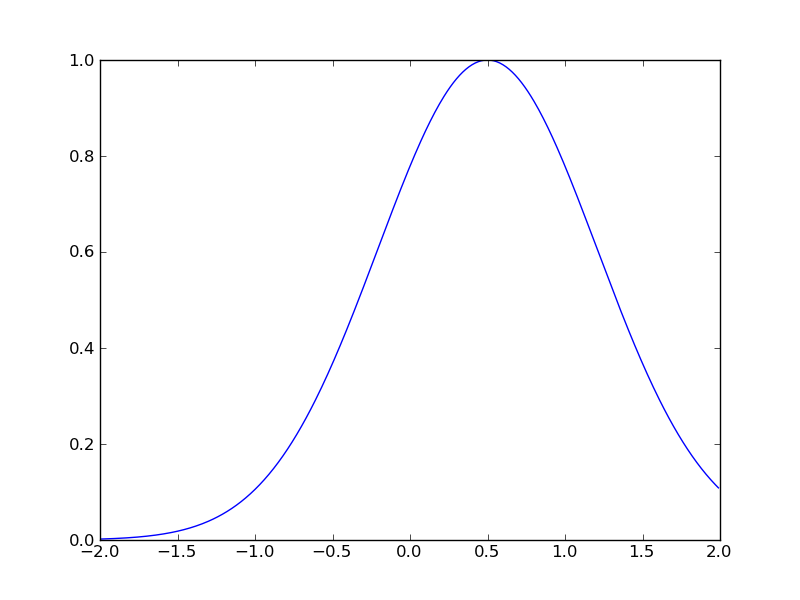
y = exp(-(x-0.5)^2)
import math
def gaussfunc(x,a,b):
   return math.exp(-a*(x-b)*(x-b))
from pylab import *
x = arange(-2.0, 2.0, 0.01)
y=[]
for e in x:
   y.append(gaussfunc(e,1.0,0.5))

plot(x, y, linewidth=1.0)
show()
三次元関数 z = exp(-1.0*x^2-0.1*y^2)*(xy+x+y)
import math
from pylab import *
def gaussfunc(x,y,a,b):
   return exp(-a*(x)*(x)-b*(y)*(y))

dx, dy = 0.05, 0.05
x = arange(-3.0, 3.0, dx)
y = arange(-3.0, 3.0, dy)
X,Y = meshgrid(x, y)
Z = gaussfunc(X, Y,1.0,0.5)*(Y*X+X+Y)
im = imshow(Z,origin='lower' ,alpha=.9)

cset = contour(Z, arange(-2.0,2.0,0.1), origin='lower'  )

clabel(cset,
   inline=1,
   fmt='%1.1f',
   fontsize=10)
hot()
colorbar()
show()
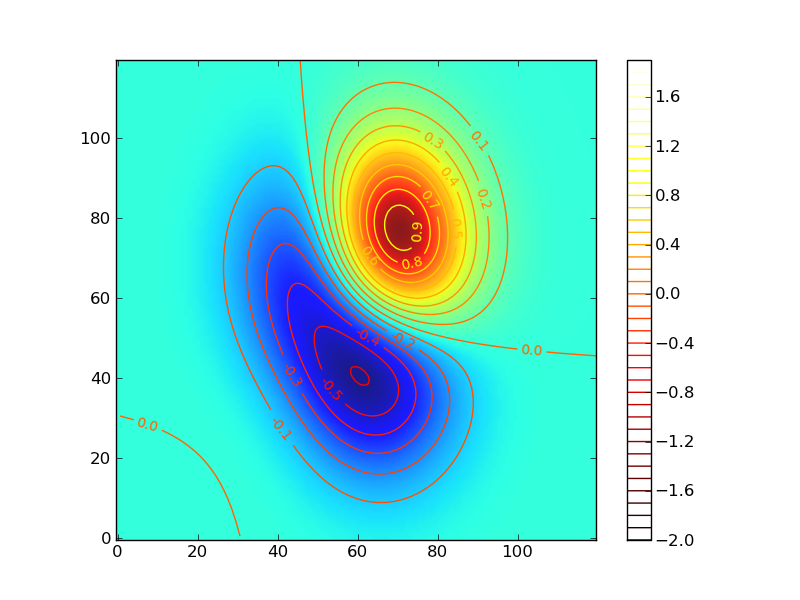
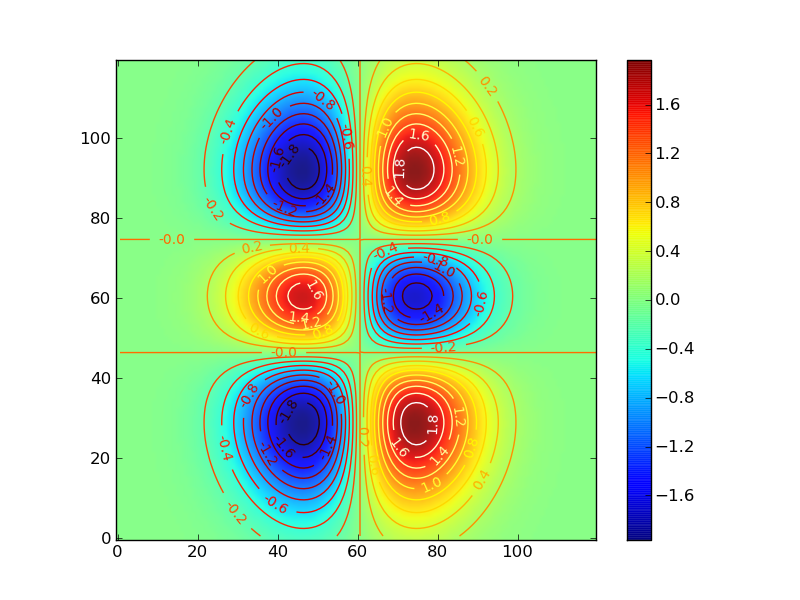
等高線いいねー
f(x,y) = exp(-X*X-Y*Y)*(2*X)*(4*Y*Y-2)
import math
from pylab import *
def gaussfunc(x,y,a,b):
   return exp(-a*(x)*(x)-b*(y)*(y))

dx, dy = 0.05, 0.05
x = arange(-3.0, 3.0, dx)
y = arange(-3.0, 3.0, dy)
X,Y = meshgrid(x, y)
Z = gaussfunc(X, Y,1.0,0.5)*(2*X)*(4*Y*Y-2)
im = imshow(Z,origin='lower' ,alpha=.9)
colorbar(im)

cset = contour(Z, arange(-2.0,2.0,0.2), origin='lower'  )

clabel(cset,
inline=1,
fmt='%1.1f',
fontsize=10)

hot()
show()
「機械学習 はじめよう」http://gihyo.jp/dev/serial/01/machine-learning/ より
第6回 Numpyの導入
In [1]: import numpy

In [2]: numpy.test()
Running unit tests for numpy
NumPy version 2.0.0.dev-3b3735d
NumPy is installed in /Library/Python/2.7/site-packages/numpy-2.0.0.dev_3b3735d_20111219-py2.7-macosx-10.7-x86_64.egg/numpy
Python version 2.7.1 (r271:86832, Jun 25 2011, 05:09:01) [GCC 4.2.1 (Based on Apple Inc. build 5658) (LLVM build 2335.15.00)]
nose version 1.1.2
........(略)
----------------------------------------------------------------------
Ran 3422 tests in 18.146s

OK (KNOWNFAIL=3, SKIP=5)
Out[2]: <nose.result.TextTestResult run=3422 errors=0 failures=0>
In [1]: import numpy as np

In [2]: np.version.version
Out[2]: '2.0.0.dev-3b3735d'

In [3]: np.lookfor('array')

Search results for 'array'
--------------------------
numpy.array
    Create an array.
numpy.asarray
    Convert the input to an array.
numpy.ndarray
    ndarray(shape, dtype=float, buffer=None, offset=0,
...
array()
In [4]: a = np.array([1,2,3,4,5])

In [5]: b = np.array([[1.,0.,0.],[0.,1.,0.],[0.,0.,1.]])

In [6]: a
Out[6]: array([1, 2, 3, 4, 5])

In [7]: b
Out[7]:
array([[ 1.,  0.,  0.],
       [ 0.,  1.,  0.],
       [ 0.,  0.,  1.]])

In [8]: a.dtype
Out[8]: dtype('int64')

In [9]: b.dtype
Out[9]: dtype('float64')

In [10]: a = np.array([1,2,3,4,5],dtype=float)

In [11]: a
Out[11]: array([ 1.,  2.,  3.,  4.,  5.])

In [12]: a.dtype
Out[12]: dtype('float64')
In [13]: a = np.arange(0.0, 10.0, 0.1)

In [14]: a
Out[14]:
array([ 0. ,  0.1,  0.2,  0.3,  0.4,  0.5,  0.6,  0.7,  0.8,  0.9,  1. ,
        1.1,  1.2,  1.3,  1.4,  1.5,  1.6,  1.7,  1.8,  1.9,  2. ,  2.1,
        2.2,  2.3,  2.4,  2.5,  2.6,  2.7,  2.8,  2.9,  3. ,  3.1,  3.2,
        3.3,  3.4,  3.5,  3.6,  3.7,  3.8,  3.9,  4. ,  4.1,  4.2,  4.3,
        4.4,  4.5,  4.6,  4.7,  4.8,  4.9,  5. ,  5.1,  5.2,  5.3,  5.4,
        5.5,  5.6,  5.7,  5.8,  5.9,  6. ,  6.1,  6.2,  6.3,  6.4,  6.5,
        6.6,  6.7,  6.8,  6.9,  7. ,  7.1,  7.2,  7.3,  7.4,  7.5,  7.6,
        7.7,  7.8,  7.9,  8. ,  8.1,  8.2,  8.3,  8.4,  8.5,  8.6,  8.7,
        8.8,  8.9,  9. ,  9.1,  9.2,  9.3,  9.4,  9.5,  9.6,  9.7,  9.8,
        9.9])

In [15]: a[20:40]
Out[15]:
array([ 2. ,  2.1,  2.2,  2.3,  2.4,  2.5,  2.6,  2.7,  2.8,  2.9,  3. ,
        3.1,  3.2,  3.3,  3.4,  3.5,  3.6,  3.7,  3.8,  3.9])

In [16]: a[0:100:5]
Out[16]:
array([ 0. ,  0.5,  1. ,  1.5,  2. ,  2.5,  3. ,  3.5,  4. ,  4.5,  5. ,
        5.5,  6. ,  6.5,  7. ,  7.5,  8. ,  8.5,  9. ,  9.5])
In [17]: a = np.arange(16)

In [18]: a
Out[18]: array([ 0,  1,  2,  3,  4,  5,  6,  7,  8,  9, 10, 11, 12, 13, 14, 15])

In [19]: a.reshape(4,4)
Out[19]:
array([[ 0,  1,  2,  3],
       [ 4,  5,  6,  7],
       [ 8,  9, 10, 11],
       [12, 13, 14, 15]])

In [20]: a
Out[20]: array([ 0,  1,  2,  3,  4,  5,  6,  7,  8,  9, 10, 11, 12, 13, 14, 15])

In [21]: np.ravel(a)
Out[21]: array([ 0,  1,  2,  3,  4,  5,  6,  7,  8,  9, 10, 11, 12, 13, 14, 15])

In [22]: a
Out[22]: array([ 0,  1,  2,  3,  4,  5,  6,  7,  8,  9, 10, 11, 12, 13, 14, 15])
In [23]: a = np.array([[1,2,3]])

In [24]: a + 2
Out[24]: array([[3, 4, 5]])

In [25]: a * 2.0
Out[25]: array([[ 2.,  4.,  6.]])

In [26]: b = np.array([[4,5,6]])

In [27]: a + b
Out[27]: array([[5, 7, 9]])

In [28]: a * b
Out[28]: array([[ 4, 10, 18]])
統計関連の操作
In [1]: import numpy as np

In [2]: height = np.random.randint(140, 190, 100)

In [3]: height
Out[3]:
array([182, 176, 189, 145, 184, 176, 160, 189, 151, 182, 155, 141, 156,
       187, 161, 145, 143, 182, 153, 140, 149, 184, 181, 152, 163, 167,
       149, 174, 167, 154, 169, 163, 177, 186, 154, 148, 152, 176, 188,
       184, 157, 168, 178, 180, 140, 142, 152, 161, 181, 151, 172, 174,
       170, 181, 184, 166, 163, 167, 170, 173, 173, 155, 142, 144, 148,
       168, 179, 180, 147, 143, 157, 182, 171, 158, 184, 180, 149, 143,
       168, 165, 145, 165, 158, 151, 173, 172, 173, 162, 166, 146, 160,
       157, 161, 167, 158, 159, 161, 152, 161, 153])

In [4]: np.mean(height)  ←平均値
Out[4]: 164.0

In [5]: np.median(height)  ←中央値
Out[5]: 163.0

In [6]: np.std(height)  ←標準偏差
Out[6]: 13.803622712896784

In [7]: np.sum(height)  ←総和
Out[7]: 16400

In [8]: np.amax(height)  ←最大値
Out[8]: 189

In [9]: np.amin(height)  ←最小値
Out[9]: 140
その他
- 公式ドキュメント http://www.scipy.org/Numpy_Example_List#head-31c979932d848274e1a1d0c6a0b1ecdd18cfa1da
- Numpy/ScipyのCookBook http://www.scipy.org/Cookbook
第7回 代表的な離散型確率分布
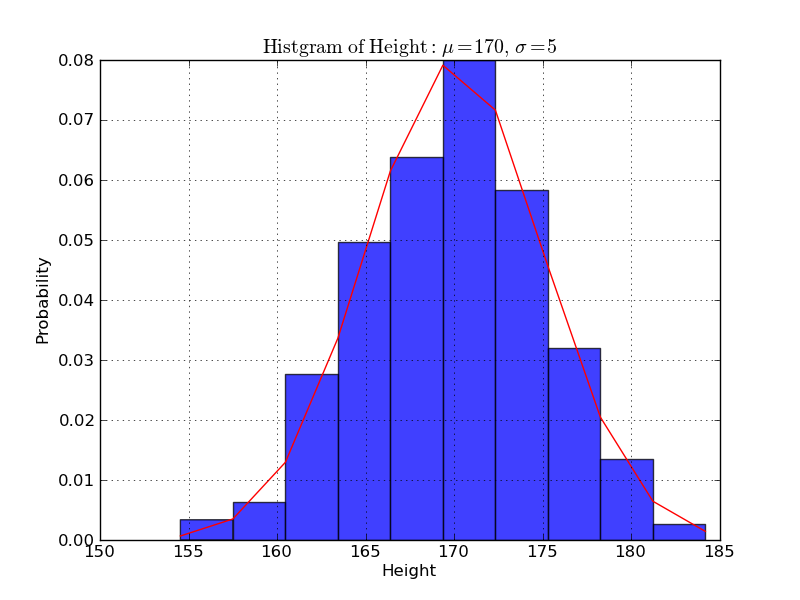
身長のヒストグラム
In [1]: import matplotlib.mlab as mlab

In [2]: import matplotlib.pyplot as plt

In [3]: import numpy as np

In [4]: sample = 1000

In [5]: mu, sigma = 170, 5

In [6]: data = np.random.normal(mu, sigma, sample)

In [7]: n, bins, patches = plt.hist(data, normed=1, alpha=0.75, align='mid')
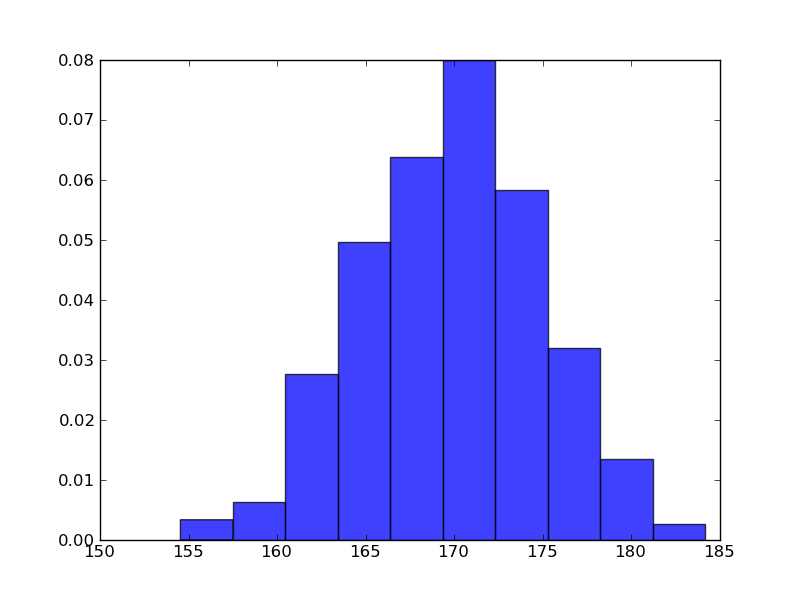
In [8]: y = mlab.normpdf(bins, mu, sigma)

In [9]: l = plt.plot(bins, y, 'r-', linewidth=1)
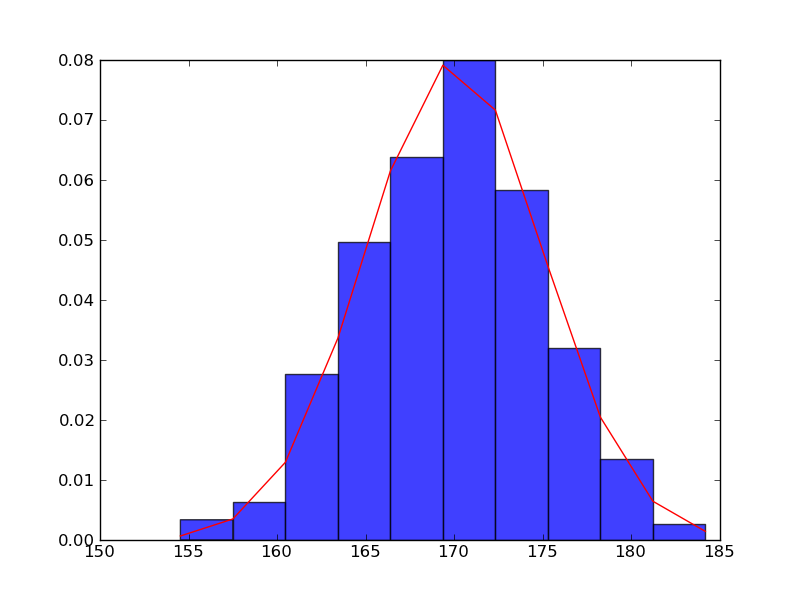
In [10]: plt.title(r'$\mathrm{Histgram\ of\ Height:}\ \mu=%d,\ \sigma=%d$' % (mu, sigma))
Out[10]: <matplotlib.text.Text at 0x110695b50>
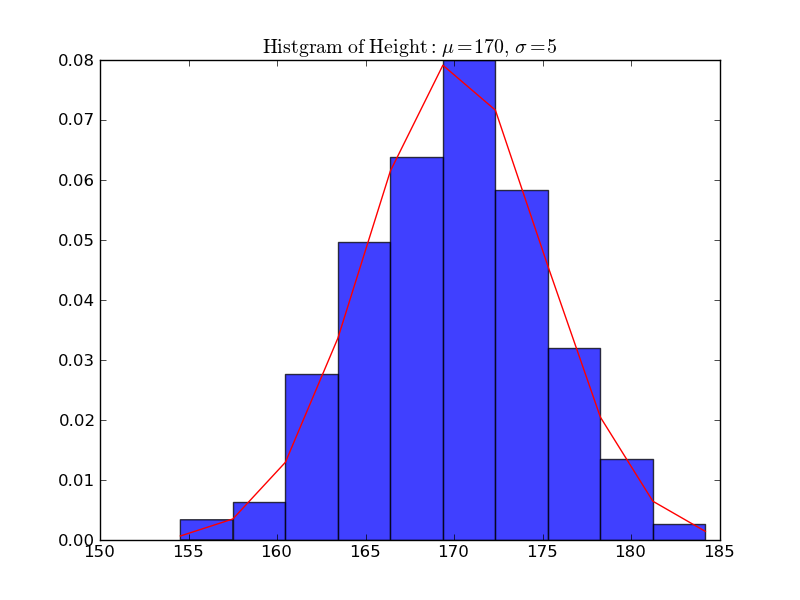
In [11]: plt.xlabel('Height')
Out[11]: <matplotlib.text.Text at 0x110686410>
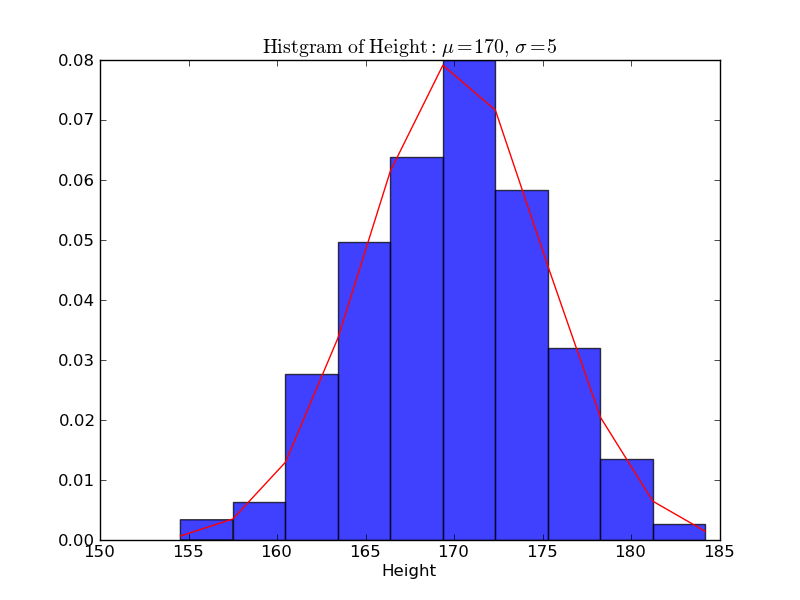
In [12]: plt.ylabel('Probability')
Out[12]: <matplotlib.text.Text at 0x110689d90>
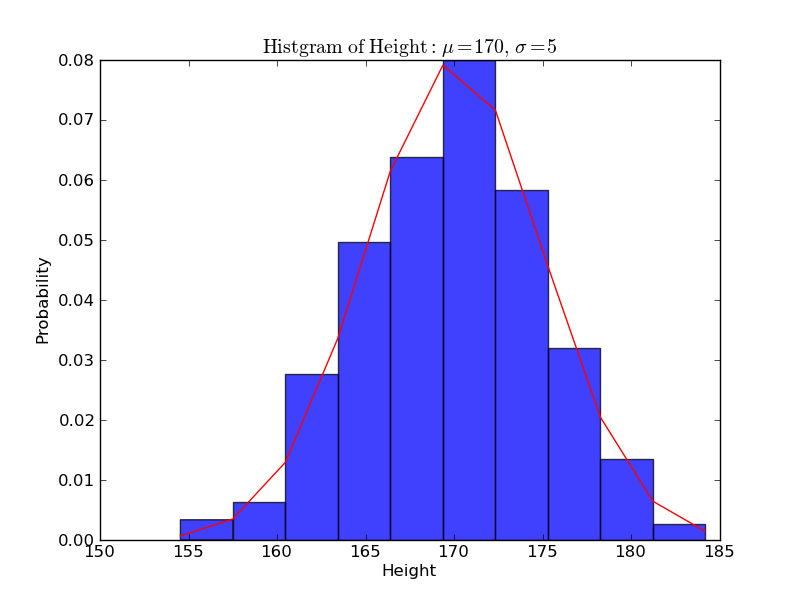
In [13]: plt.grid(True)

In [14]: plt.show()
http://www.scipy.org/Getting_Started より
In [1]: %logstart
Activating auto-logging. Current session state plus future input saved.
Filename       : ipython_log.py
Mode           : rotate
Output logging : False
Raw input log  : False
Timestamping   : False
State          : active

In [2]: from scipy import *

In [3]: a = zeros(1000)
 → ゼロが1000個、のarray([...])

In [4]: a[:100]=1
 → a[0]〜a[99] に1を

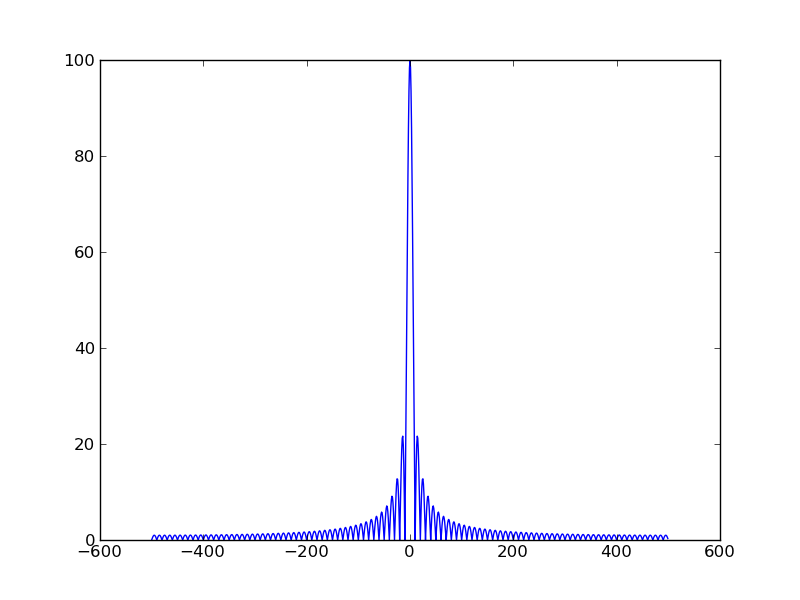
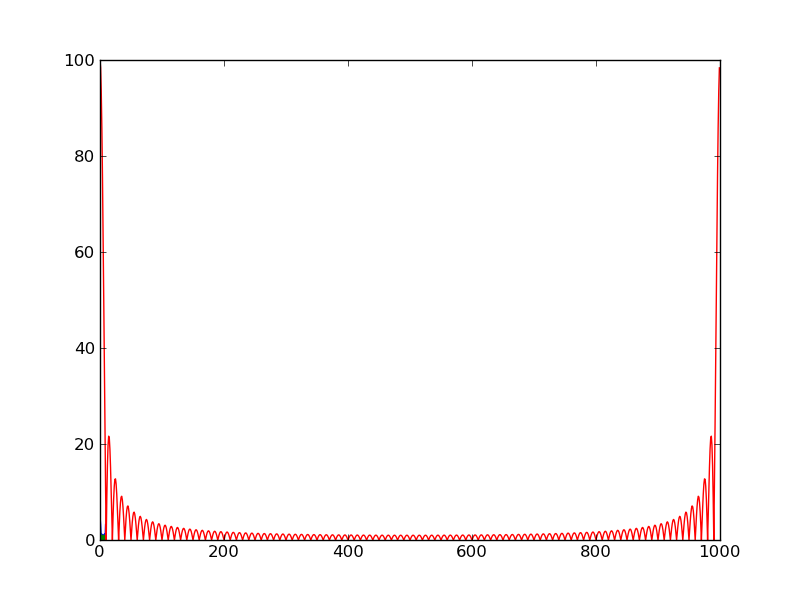
In [5]: b =fft(a)
 → FFT (scipy)

In [6]: plot(abs(b))
Out[6]: [<matplotlib.lines.Line2D instance at 0xb7b9144c>]

In [7]: show()
 →plot()の段階で見えてない?
In [8]: concatenate?
Type:           builtin_function_or_method
Base Class:     <type 'builtin_function_or_method'>
String Form:    <built-in function concatenate>
Namespace:      Interactive
Docstring:
    concatenate((a1, a2, ...), axis=0)
    Join arrays together.
    The tuple of sequences (a1, a2, ...) are joined along the given axis
    (default is the first one) into a single numpy array.
    Example:
    >>> concatenate( ([0,1,2], [5,6,7]) )
    array([0, 1, 2, 5, 6, 7])

In [9]: f = arange(-500,500,1)
 → -500〜499の範囲のarray([...])

In [10]: grid(True)

In [11]: plot(f,abs(concatenate((b[500:],b[:500]))))
Out[11]: [<matplotlib.lines.Line2D instance at 0xb360ca4c>]

In [12]: show()
