「機械学習 はじめよう」http://gihyo.jp/dev/serial/01/machine-learning/ より
第6回 Numpyの導入
In [1]: import numpy

In [2]: numpy.test()
Running unit tests for numpy
NumPy version 2.0.0.dev-3b3735d
NumPy is installed in /Library/Python/2.7/site-packages/numpy-2.0.0.dev_3b3735d_20111219-py2.7-macosx-10.7-x86_64.egg/numpy
Python version 2.7.1 (r271:86832, Jun 25 2011, 05:09:01) [GCC 4.2.1 (Based on Apple Inc. build 5658) (LLVM build 2335.15.00)]
nose version 1.1.2
........(略)
----------------------------------------------------------------------
Ran 3422 tests in 18.146s

OK (KNOWNFAIL=3, SKIP=5)
Out[2]: <nose.result.TextTestResult run=3422 errors=0 failures=0>
In [1]: import numpy as np

In [2]: np.version.version
Out[2]: '2.0.0.dev-3b3735d'

In [3]: np.lookfor('array')

Search results for 'array'
--------------------------
numpy.array
    Create an array.
numpy.asarray
    Convert the input to an array.
numpy.ndarray
    ndarray(shape, dtype=float, buffer=None, offset=0,
...
array()
In [4]: a = np.array([1,2,3,4,5])

In [5]: b = np.array([[1.,0.,0.],[0.,1.,0.],[0.,0.,1.]])

In [6]: a
Out[6]: array([1, 2, 3, 4, 5])

In [7]: b
Out[7]:
array([[ 1.,  0.,  0.],
       [ 0.,  1.,  0.],
       [ 0.,  0.,  1.]])

In [8]: a.dtype
Out[8]: dtype('int64')

In [9]: b.dtype
Out[9]: dtype('float64')

In [10]: a = np.array([1,2,3,4,5],dtype=float)

In [11]: a
Out[11]: array([ 1.,  2.,  3.,  4.,  5.])

In [12]: a.dtype
Out[12]: dtype('float64')
In [13]: a = np.arange(0.0, 10.0, 0.1)

In [14]: a
Out[14]:
array([ 0. ,  0.1,  0.2,  0.3,  0.4,  0.5,  0.6,  0.7,  0.8,  0.9,  1. ,
        1.1,  1.2,  1.3,  1.4,  1.5,  1.6,  1.7,  1.8,  1.9,  2. ,  2.1,
        2.2,  2.3,  2.4,  2.5,  2.6,  2.7,  2.8,  2.9,  3. ,  3.1,  3.2,
        3.3,  3.4,  3.5,  3.6,  3.7,  3.8,  3.9,  4. ,  4.1,  4.2,  4.3,
        4.4,  4.5,  4.6,  4.7,  4.8,  4.9,  5. ,  5.1,  5.2,  5.3,  5.4,
        5.5,  5.6,  5.7,  5.8,  5.9,  6. ,  6.1,  6.2,  6.3,  6.4,  6.5,
        6.6,  6.7,  6.8,  6.9,  7. ,  7.1,  7.2,  7.3,  7.4,  7.5,  7.6,
        7.7,  7.8,  7.9,  8. ,  8.1,  8.2,  8.3,  8.4,  8.5,  8.6,  8.7,
        8.8,  8.9,  9. ,  9.1,  9.2,  9.3,  9.4,  9.5,  9.6,  9.7,  9.8,
        9.9])

In [15]: a[20:40]
Out[15]:
array([ 2. ,  2.1,  2.2,  2.3,  2.4,  2.5,  2.6,  2.7,  2.8,  2.9,  3. ,
        3.1,  3.2,  3.3,  3.4,  3.5,  3.6,  3.7,  3.8,  3.9])

In [16]: a[0:100:5]
Out[16]:
array([ 0. ,  0.5,  1. ,  1.5,  2. ,  2.5,  3. ,  3.5,  4. ,  4.5,  5. ,
        5.5,  6. ,  6.5,  7. ,  7.5,  8. ,  8.5,  9. ,  9.5])
In [17]: a = np.arange(16)

In [18]: a
Out[18]: array([ 0,  1,  2,  3,  4,  5,  6,  7,  8,  9, 10, 11, 12, 13, 14, 15])

In [19]: a.reshape(4,4)
Out[19]:
array([[ 0,  1,  2,  3],
       [ 4,  5,  6,  7],
       [ 8,  9, 10, 11],
       [12, 13, 14, 15]])

In [20]: a
Out[20]: array([ 0,  1,  2,  3,  4,  5,  6,  7,  8,  9, 10, 11, 12, 13, 14, 15])

In [21]: np.ravel(a)
Out[21]: array([ 0,  1,  2,  3,  4,  5,  6,  7,  8,  9, 10, 11, 12, 13, 14, 15])

In [22]: a
Out[22]: array([ 0,  1,  2,  3,  4,  5,  6,  7,  8,  9, 10, 11, 12, 13, 14, 15])
In [23]: a = np.array([[1,2,3]])

In [24]: a + 2
Out[24]: array([[3, 4, 5]])

In [25]: a * 2.0
Out[25]: array([[ 2.,  4.,  6.]])

In [26]: b = np.array([[4,5,6]])

In [27]: a + b
Out[27]: array([[5, 7, 9]])

In [28]: a * b
Out[28]: array([[ 4, 10, 18]])
統計関連の操作
In [1]: import numpy as np

In [2]: height = np.random.randint(140, 190, 100)

In [3]: height
Out[3]:
array([182, 176, 189, 145, 184, 176, 160, 189, 151, 182, 155, 141, 156,
       187, 161, 145, 143, 182, 153, 140, 149, 184, 181, 152, 163, 167,
       149, 174, 167, 154, 169, 163, 177, 186, 154, 148, 152, 176, 188,
       184, 157, 168, 178, 180, 140, 142, 152, 161, 181, 151, 172, 174,
       170, 181, 184, 166, 163, 167, 170, 173, 173, 155, 142, 144, 148,
       168, 179, 180, 147, 143, 157, 182, 171, 158, 184, 180, 149, 143,
       168, 165, 145, 165, 158, 151, 173, 172, 173, 162, 166, 146, 160,
       157, 161, 167, 158, 159, 161, 152, 161, 153])

In [4]: np.mean(height)  ←平均値
Out[4]: 164.0

In [5]: np.median(height)  ←中央値
Out[5]: 163.0

In [6]: np.std(height)  ←標準偏差
Out[6]: 13.803622712896784

In [7]: np.sum(height)  ←総和
Out[7]: 16400

In [8]: np.amax(height)  ←最大値
Out[8]: 189

In [9]: np.amin(height)  ←最小値
Out[9]: 140
その他
- 公式ドキュメント http://www.scipy.org/Numpy_Example_List#head-31c979932d848274e1a1d0c6a0b1ecdd18cfa1da
- Numpy/ScipyのCookBook http://www.scipy.org/Cookbook
第7回 代表的な離散型確率分布
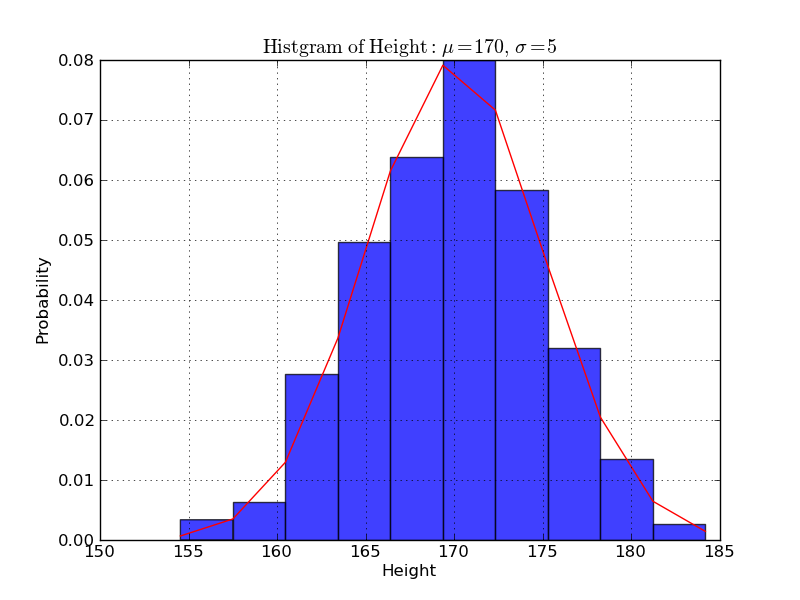
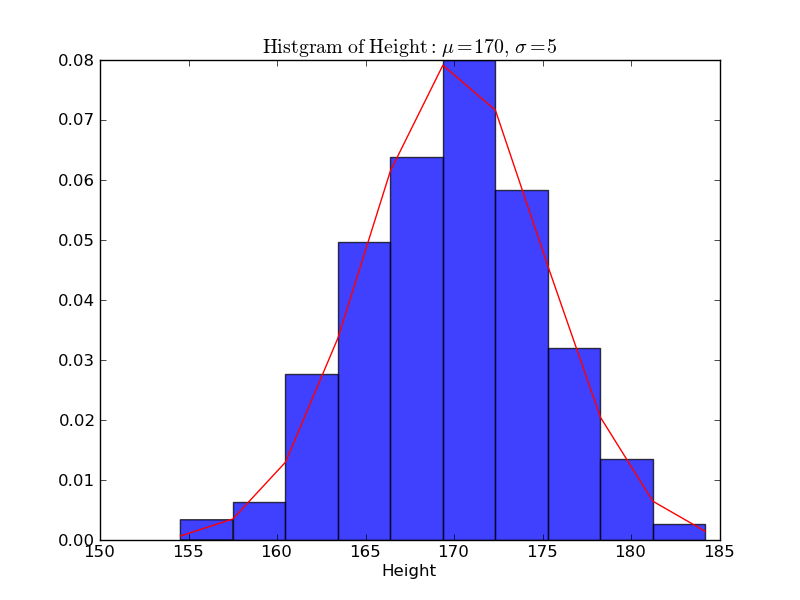
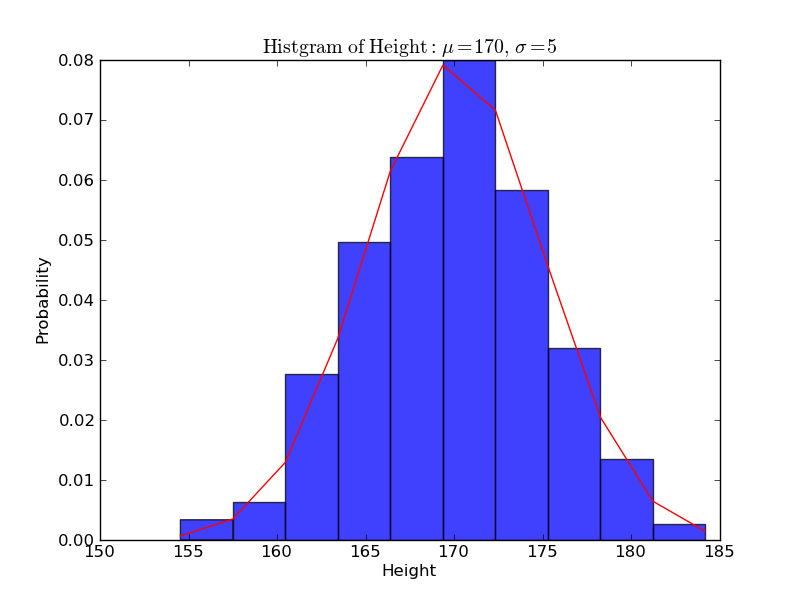
身長のヒストグラム
In [1]: import matplotlib.mlab as mlab

In [2]: import matplotlib.pyplot as plt

In [3]: import numpy as np

In [4]: sample = 1000

In [5]: mu, sigma = 170, 5

In [6]: data = np.random.normal(mu, sigma, sample)

In [7]: n, bins, patches = plt.hist(data, normed=1, alpha=0.75, align='mid')
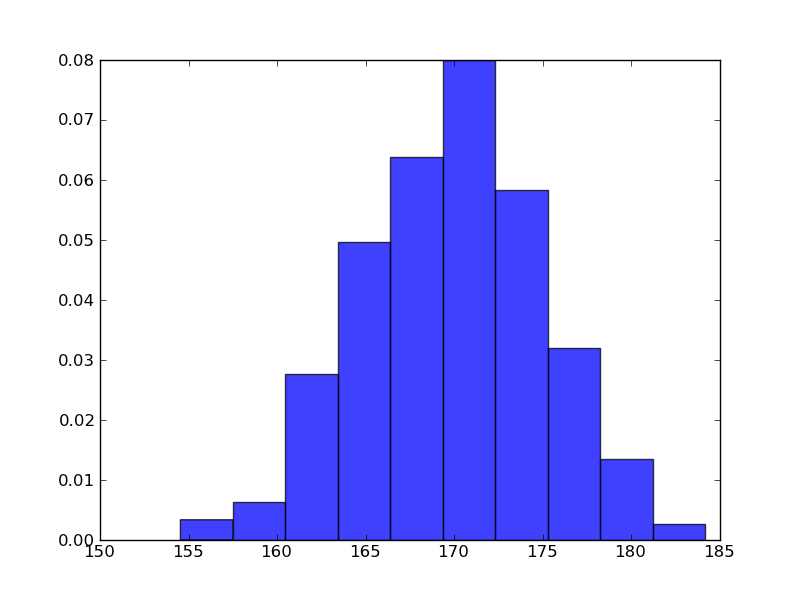
In [8]: y = mlab.normpdf(bins, mu, sigma)

In [9]: l = plt.plot(bins, y, 'r-', linewidth=1)
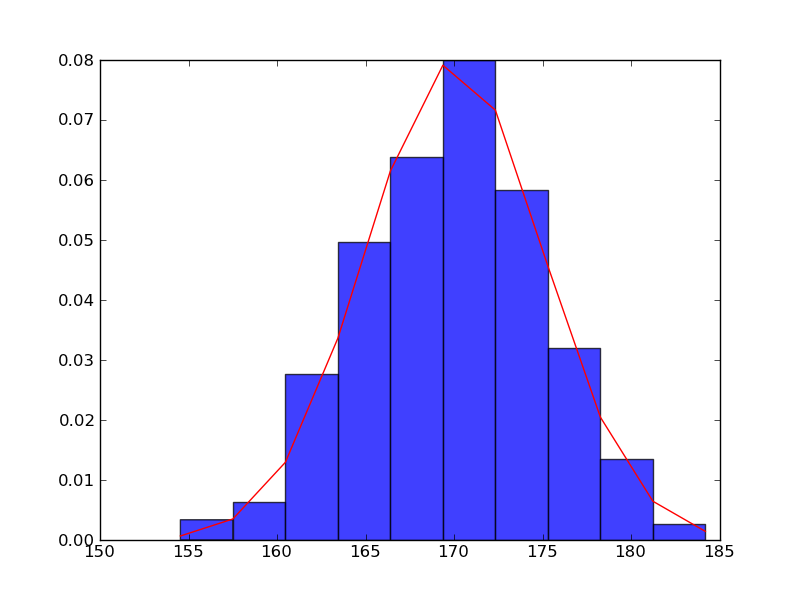
In [10]: plt.title(r'$\mathrm{Histgram\ of\ Height:}\ \mu=%d,\ \sigma=%d$' % (mu, sigma))
Out[10]: <matplotlib.text.Text at 0x110695b50>
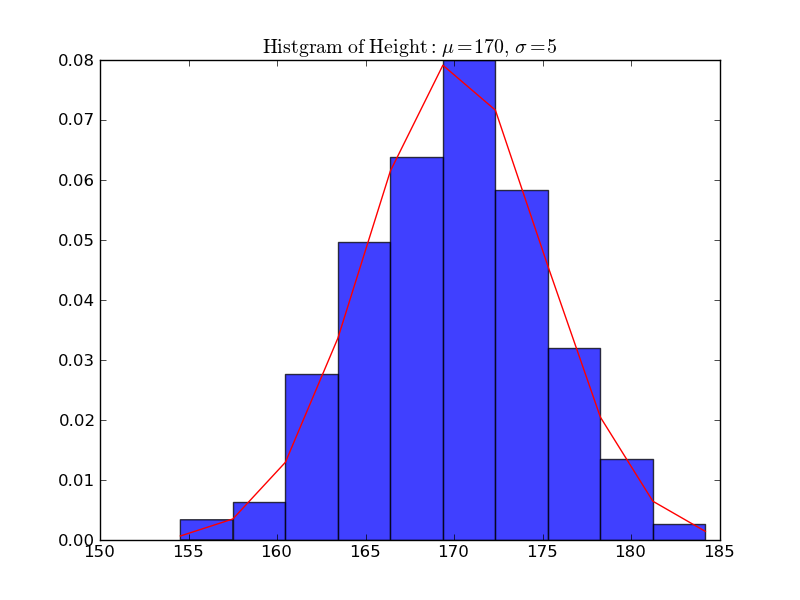
In [11]: plt.xlabel('Height')
Out[11]: <matplotlib.text.Text at 0x110686410>
In [12]: plt.ylabel('Probability')
Out[12]: <matplotlib.text.Text at 0x110689d90>
In [13]: plt.grid(True)

In [14]: plt.show()
