30 second tutorial for ipython, pylab, numpy and matplotlib http://slacy.com/blog/2008/01/30-second-tutorial-for-ipython-pylab-numpy-and-matplotlib/ より
datafile:
1 2 3
2 3 4
3 2 3
4 1 2
5 0 1
6 1 0
7 2 1
8 3 2
9 2 3
これを読み込んでプロットしてみる。
load() では駄目で、loadtxt() ならOK。
pylab no longer provides a load function, though the old pylab function is still available as matplotlib.mlab.load (you can refer to it in pylab as "mlab.load"). However, for plain text files, we recommend numpy.loadtxt, which was inspired by the old pylab.load but now has more features. For loading numpy arrays, we recommend numpy.load, and its analog numpy.save, which are available in pylab as np.load and np.save.
とな
legend() というのはグラフの凡例を描画してくれるらしい。
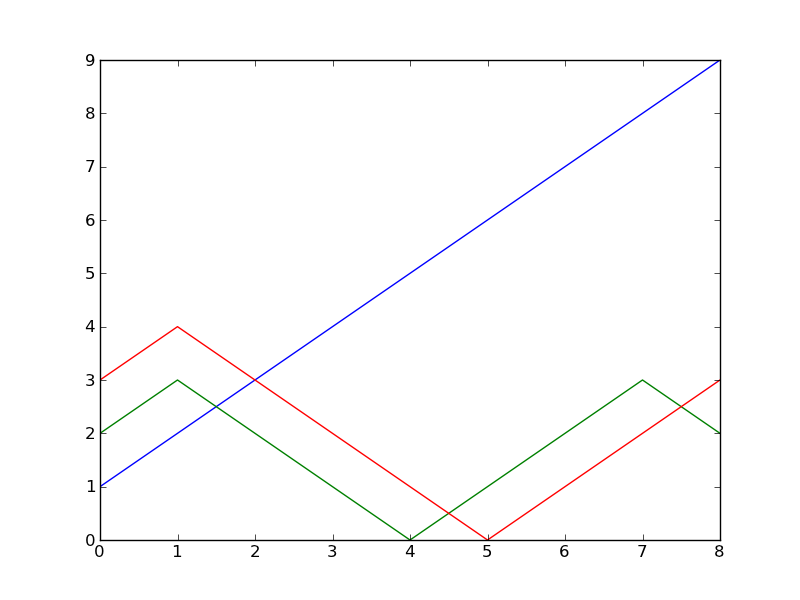
your_data = loadtxt("./datafile")
plot(your_data)
legend()
show()

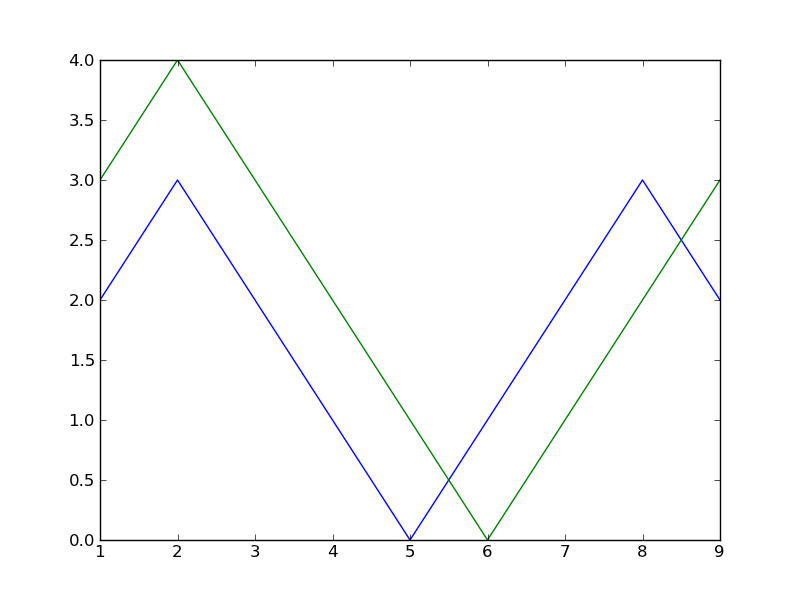
最初のカラムをX軸と取ったらこんな感じ?
x = loadtxt("./datafile")
plot(x[:,0], x[:,1])
plot(x[:,0], x[:,2])
show()
